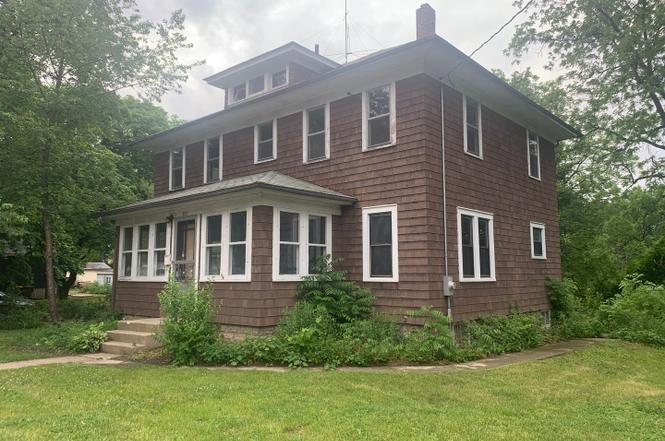
605 E Calhoun St
Woodstock, IL 60098
$242,000C-
4 bd · 1.0 ba ·
1,872 sqft ·
Built 1900
· SingleFamily
· Coming Soon
· 11 DOM
Cashflow @ list (25.0% down · 7.5%)
Estimated rent
$2,232/mo
Mortgage (P&I)
−$1,269
Tax + insurance
−$403
HOA
−$0
Vac / Maint / Mgmt
−$469
Net cashflow
$91/mo
Annual
$1,095/yr
Cap rate
6.75%
Cash-on-cash
1.62%
DSCR
1.07
1% rule
0.92%
Cash to close
$67,760
Investor read
- This is a 4-bed/1.0-bath single-family listed at $242k.
- At list price, monthly cash flow is $91 ($1k/yr) — positive.
- The deal already cash-flows at list — no discount required.
- To meet the 1% rule (rent ≥ 1% of price), the offer needs to be $223k (7.8% below list).
- Only 11 days on market — expect competitive offers; lowballing is unlikely to land.
- Recommended offer: $223k (7.8% below list) — sets the bar for 1% rule.
- Local home prices are declining (-3.0%/yr); year-one equity from $2k of loan paydown is wiped out by about $7k of value loss. Plan a longer hold.
- Location reads 82/100 on livability (#66 in IL, #1,114 nationally) — a professional / high-income tenant draw. Strengths: crime A+, cost of living A+, housing A+.
- Woodstock CUSD 200 (town): math 24% / reading 38% proficiency, ranked #220 of 620 in IL (top 36%) — families likely to look elsewhere, expect single-tenant / working-renter base with shorter leases.
- Zoned schools: Verda Dierzen Early Learning Ctr (701 students, 0% FRL); Creekside Middle School (math 29% / reading 47%, grade F, #159 of 665 statewide, top 25%, 728 students, 0% FRL); Woodstock High School (math 28% / reading 40%, grade F, #147 of 693 statewide, top 22%, 1,021 students, 0% FRL) — zoned schools average 0% FRL vs 36% district-wide (36 pts lower); this property's tenant base skews higher-income than the district average.
- Watch-outs: built in 1900 — expect roof / HVAC / electrical / plumbing capex.
- Market conditions: 137 active listings in the ZIP; 1 comparable units currently listed for rent nearby; solid renter incomes; 1,595 units permitted in McHenry County in 2024 (485 in 5+ unit buildings).
- McHenry County population projected at -12% by 2050 — secular population decline; favor cash flow + early exit over multi-decade hold.
- Cap rate 6.7% vs local median 2.6% in Woodstock — top-decile yield for the area; either an underpriced asset or a hidden risk that comps aren't pricing in. Stress-test before assuming the spread holds.
Questions for listing agent
- Built in 1900 — when were the roof, HVAC, electrical panel, plumbing, and water heater last replaced?
- Is there a deadline driving the sale (1031 exchange, divorce, estate, relocation)? That informs how much negotiation room exists.
- Schools are D-rated, which usually means shorter tenancies and higher turnover. Who's the typical renter profile here, and what's been the actual vacancy rate?
- What's the average days-on-market for RENTAL listings here right now (not sales)? A rising rental-DOM trend means longer vacancies and softer asking-rent achievability than the comps imply.
- What's the recent tenant-quality profile in this submarket — average credit score on applications, eviction rate, late-payment / NSF rate, and stable-employment percentage? A property-management company in the area should have these aggregated.
- How much new for-sale + rental construction is in the pipeline within 1–3 miles? Heavy new supply typically softens prices + rents 12–24 months out; constrained supply supports both.
CashFlowRE · CFR-9226YZ94YNZWXV
· Data 1 day ago
cashflowre.app · 2026-05-29