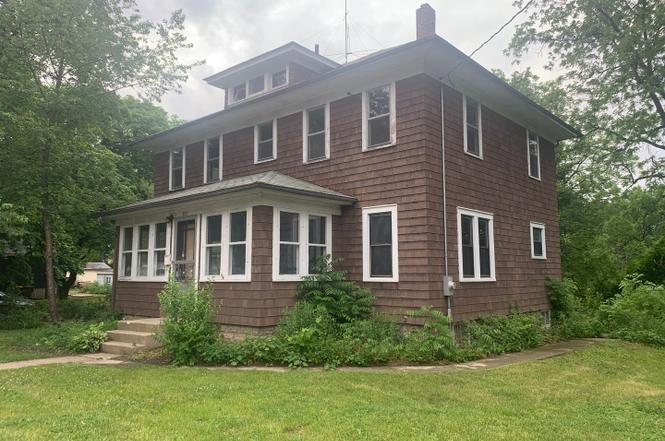
605 E Calhoun St · Woodstock, IL
Flood risk No data
- FEMA flood zone
- —
- Chance of flooding over 30 yrs
- —
- Est. flood insurance / yr
- —
Fire risk No data
- Est. fire insurance / yr
- —
Heat risk No data
- Hot days now (above threshold)
- —
- Hot days in 30 yrs
- —
Wind risk No data
- Chance of severe wind over 30 yrs
- —
Air-quality risk No data
- Unhealthy air days now
- —
- Unhealthy air days in 30 yrs
- —
Risk factors via First Street. Map © Google.
Why this score? — see what drove the C- grade
The composite is a weighted blend of 9 inputs, each scored 0–100. Each bar is that input's sub-score; the figure is the points it added to the 100-point composite (weight × sub-score).
- Cash flow +15.4/30.0
- ARV discount +15.0/15.0
- DSCR +4.7/10.0
- 1% rule +4.2/10.0
- Livability +4.1/5.0
- Schools +2.8/10.0
- Rent growth +2.5/5.0
- Condition / age +2.5/5.0
- Appreciation +0.0/10.0
$242,000
🖨 Deal sheet (PDF) 📄 Offer letter ✓ Due diligence
Key facts
- Garage
- Built 1900
Property features AI
Exterior
- Parking: Has garage
- Home design: Single-family property
- Construction: Living area approximately 1,872
Interior
- Bedrooms: 4 bedrooms
- Bathrooms: 1 bathroom
- Interior features: Single-family home
Neighborhood map
What this means for you Summary
Snapshot
- This is a 4-bed/1.0-bath single-family listed at $242k.
Deal economics
- At list price, monthly cash flow is $91 ($1k/yr) — positive.
- The deal already cash-flows at list — no discount required.
- To meet the 1% rule (rent ≥ 1% of price), the offer needs to be $223k (7.8% below list).
- Recommended offer: $223k (7.8% below list) — sets the bar for 1% rule.
- Cap rate 6.7% vs local median 2.6% in Woodstock — top-decile yield for the area; either an underpriced asset or a hidden risk that comps aren't pricing in. Stress-test before assuming the spread holds.
Location & tenants
- Location reads 82/100 on livability (#66 in IL, #1,114 nationally) — a professional / high-income tenant draw. Strengths: crime A+, cost of living A+, housing A+.
- Woodstock CUSD 200 (town): math 24% / reading 38% proficiency, ranked #220 of 620 in IL (top 36%) — families likely to look elsewhere, expect single-tenant / working-renter base with shorter leases.
- Zoned schools: Verda Dierzen Early Learning Ctr (701 students, 0% FRL); Creekside Middle School (math 29% / reading 47%, grade F, #159 of 665 statewide, top 25%, 728 students, 0% FRL); Woodstock High School (math 28% / reading 40%, grade F, #147 of 693 statewide, top 22%, 1,021 students, 0% FRL) — zoned schools average 0% FRL vs 36% district-wide (36 pts lower); this property's tenant base skews higher-income than the district average.
- Market conditions: 137 active listings in the ZIP; 1 comparable units currently listed for rent nearby; solid renter incomes; 1,595 units permitted in McHenry County in 2024 (485 in 5+ unit buildings).
Forward outlook
- Local home prices are declining (-3.0%/yr); year-one equity from $2k of loan paydown is wiped out by about $7k of value loss. Plan a longer hold.
- McHenry County population projected at -12% by 2050 — secular population decline; favor cash flow + early exit over multi-decade hold.
Negotiation context
- Only 11 days on market — expect competitive offers; lowballing is unlikely to land.
Risks & watch-outs
- Watch-outs: built in 1900 — expect roof / HVAC / electrical / plumbing capex.
Questions for the listing agent
- Built in 1900 — when were the roof, HVAC, electrical panel, plumbing, and water heater last replaced?
- Is there a deadline driving the sale (1031 exchange, divorce, estate, relocation)? That informs how much negotiation room exists.
- Schools are D-rated, which usually means shorter tenancies and higher turnover. Who's the typical renter profile here, and what's been the actual vacancy rate?
- What's the average days-on-market for RENTAL listings here right now (not sales)? A rising rental-DOM trend means longer vacancies and softer asking-rent achievability than the comps imply.
- What's the recent tenant-quality profile in this submarket — average credit score on applications, eviction rate, late-payment / NSF rate, and stable-employment percentage? A property-management company in the area should have these aggregated.
- How much new for-sale + rental construction is in the pipeline within 1–3 miles? Heavy new supply typically softens prices + rents 12–24 months out; constrained supply supports both.
Investment metrics
- 1% rule
- 0.92% ✗
- Cap rate
- 6.75%
- Cash-on-cash
- 1.62%
- DSCR
- 1.07
- GRM
- 9.0
CMA / ARV
- ARV (on-the-fly)
- $346,320
- Comps found
- 12
Show comp detail 12 sales within ~0.75 mi
| Address | Dist | Beds/Ba | Sqft | Sold | Price | $/sf | Match |
|---|---|---|---|---|---|---|---|
| 601 S Jefferson St S | 0.46mi | 4/2.0 | 1,990 (+6%) | 3mo | $275,000 | $138 | 61 |
| 430 Laurel Ave | 0.51mi | 3/2.0 (-1) | 1,828 (-2%) | 8mo | $351,000 | $192 | 57 |
| 324 N Madison St | 0.33mi | 5/1.0 (+1) | 1,670 (-11%) | 6mo | $250,000 | $150 | 56 |
| 605 N Seminary Ave | 0.43mi | 3/1.0 (-1) | 1,667 (-11%) | 2mo | $265,000 | $159 | 55 |
| 517 Bunker St | 0.50mi | 4/1.5 | 1,623 (-13%) | 5mo | $290,000 | $179 | 48 |
| 389 Lincoln Ave | 0.73mi | 3/1.5 (-1) | 1,784 (-5%) | 6mo | $338,000 | $189 | 46 |
| 841 N Madison St | 0.67mi | 4/2.0 | 2,013 (+8%) | 8mo | $372,000 | $185 | 45 |
| 801 S Jefferson St | 0.56mi | 3/2.0 (-1) | 2,124 (+14%) | 1mo | $340,000 | $160 | 42 |
| 310 S Tryon St | 0.57mi | 3/2.0 (-1) | 2,070 (+11%) | 9mo | $383,000 | $185 | 39 |
| 241 Hoy Ave | 0.59mi | 4/2.0 | 1,606 (-14%) | 9mo | $365,500 | $228 | 37 |
| 902 Bunker St | 0.68mi | 3/2.0 (-1) | 1,645 (-12%) | 8mo | $335,000 | $204 | 32 |
| 871 Hickman Ln | 0.74mi | 3/3.0 (-1) | 1,630 (-13%) | 5mo | $340,000 | $209 | 27 |
Match score weights: distance 35% · size 25% · config 20% · recency 20%. Top-matched comps best support the ARV.
Projected returns pro-forma
-3.0% appreciation · 3.0% rent growth · sell at horizon
- IRR
- -13.7%
- Equity multiple
- 0.51×
- Total profit
- $-33,371
- Equity at exit
- $36,083
- IRR
- -4.8%
- Equity multiple
- 0.68×
- Total profit
- $-21,442
- Equity at exit
- $20,924
Cash invested: $67,760 (down + closing). Projections, not guarantees.
Landlord ↔ Tenant lean methodology
- Overall (STATE)
- 43 Moderately Tenant-Leaning
- State Illinois
- 43 Moderately Tenant-Leaning · D+7
- County
- — inherits STATE
- City
- — inherits STATE
ZIP-level market 60098
- Home prices YoY
- -30.0%
- Active inventory
- 137
- Price-to-rent
- 9.0×
Monthly cashflow live
- Estimated rent
- $2,232 medium interval (Pro) →
- Mortgage (P&I)
- −$1,269
- Tax est. 1.5%
- −$302 /mo · $3,630/yr
- Insurance
- −$101
- HOA
- −$0
- Vacancy / Maint / Mgmt
- −$469
- Net cashflow
- $91
Break-even live
Sensitivity live
| Price | -10% $258 | -5% $175 | +0% $91 | +5% $8 | +10% $-76 |
|---|---|---|---|---|---|
| Rent | -10% $-85 | -5% $3 | +0% $91 | +5% $179 | +10% $268 |
| Rate | -1.0pp $213 | -0.5pp $153 | base $91 | +0.5pp $29 | +1.0pp $-35 |
UW: 25.0% down · 7.5% · 30yr · 1.5% tax · 5.0% vac · 8.0% maint · 8.0% mgmt
Financing live
Cash to close
- Down payment
- $60,500
- Closing costs
- $7,260
- Reserves months
- —
- Total cash needed
- —
Loan-product check · same deal, 3 products live
Conventional
25% down · 7.5% · 30yr
- Down + closing
- —
- Monthly P&I
- —
- Monthly cashflow
- —
- DSCR
- —
- Eligible?
- —
Personal DTI + credit; lowest rate.
DSCR
20% down · 8.5% · 30yr
- Down + closing
- —
- Monthly P&I
- —
- Monthly cashflow
- —
- DSCR
- —
- Eligible?
- —
No personal income docs; deal must DSCR.
Hard money
10% down · 12.0% · 12mo
- Down + closing
- —
- Monthly P&I
- —
- Monthly cashflow
- —
- DSCR
- —
- Eligible?
- —
Short-term bridge; refi at stabilization.
Rent comps 1 comps
| Address | Beds | Baths | Sqft | Rent | $/sqft | DOM | Units | Dist |
|---|---|---|---|---|---|---|---|---|
| 1022 Wheeler St Unit 1022 Woodstock, IL | 3.0 | 1.5 | 2250 | $2,100 | $0.93 | 45d | 1 | 0.92mi |
Listing history 6 events
-
2026-06-21days on market $242,000 Coming Soon 11 DOM
-
2026-06-18days on market $242,000 Coming Soon 8 DOM
-
2026-06-17days on market $242,000 Coming Soon 7 DOM
-
2026-06-16days on market $242,000 Coming Soon 6 DOM
-
2026-06-15days on market $242,000 Coming Soon 5 DOM
-
2026-06-13$242,000 Coming Soon 3 DOM
ⓘ Source: listings_history table (triggers on properties + properties_extension) + one-shot
backfill from property_details.listing_events for pre-trigger history.
Nearby sold comps map
Loading sold comps map…
Walkable amenities ~0.75 mi
Loading nearby amenities…
Taxation est. · year 1
- Rental income
- $26,789
- − Mortgage interest
- −$13,556
- − Property taxes
- −$3,630
- − Insurance
- −$1,210
- − Repairs & maintenance
- −$2,143
- − Management
- −$2,143
- − Depreciation
- −$7,040
- Taxable loss
- −$2,933
- Est. tax savings @ 24.0%
- +$704
- After-tax cash flow
- $1,798/yr
For passive investors: Depreciation is non-cash, so a rental often shows a tax loss while cash-flowing — sheltering income. Rental losses are passive: they offset passive income freely, and up to $25,000/yr can offset ordinary (W-2) income if you actively participate and your MAGI is under $100k (phasing out to $0 by $150k); unused losses carry forward. On sale, claimed depreciation is recaptured at up to 25%, and gains may owe capital-gains tax (a 1031 exchange can defer both). Figures are a year-1 estimate at your 24.0% rate — not tax advice; consult a CPA.
Schools (NCES district)
- District
- Woodstock CUSD 200
- NCES district ID
- 1743330
- Math proficiency
- 24% ▼ -8.00%
- Reading proficiency
- 38% ▼ -8.00%
- Median HH income
- $64,309
- Composite
- 28.35/100
- National rank
- #6773
- State rank
- #220 of 620 in IL
Livability — Woodstock
- Score
- 82/100
- State rank
- #66
- US rank
- #1114
Category grades
Schools grade is shown separately in the Schools card above.
Census & demographics
- Census place
- Woodstock, IL
- County
- McHenry County · 204,279 people
- City population
- 33,130
- Metro
- Chicago-Naperville-Elgin, IL-IN-WI
- Population (ZIP)
- 33,130
- Household income
- $91,062
- Rent vs Own
- Severe rent burden
- 759.0
Population outlook (McHenry County) Hauer SSP2
- Today (2025)
- 305,342 people
- By 2030
- 301,491 · -1.3%
- By 2040
- 288,211 · -5.6%
- By 2050
- 268,430 · -12.1%
- By 2075
- 226,209 · -25.9%
- By 2100
- 181,247 · -40.6%
Race, ethnicity, and origin ACS 2023
- Neighborhood character
- Predominantly White (73%)
- Race & ethnicity
- White 73% Hispanic / Latino 20% Two or more races 14% Asian 2% Black 2%
- Hispanic origin (detail)
- Mexican 17% Puerto Rican 1%
- Common ancestry
- Romanian 9% Lithuanian 2% Portuguese 2%
- Foreign-born
- 12% · Canada
- Languages at home
- 79% English-only · Spanish 16% Russian/Polish/Slavic 2% Tagalog/Filipino 1%
Political lean MEDSL · McHenry
- 2024 margin
- Lean R (+5.3) · D 46.6% · R 51.9% · Other 1.5%
- 2008→2024 swing
- -10.6pp toward R · 2008: 5.3pp · 2024: -5.3pp
- All cycles
- 2024: R+5.3 2020: R+2.5 2016: R+8.1 2012: R+8.8 2008: D+5.3
Not yet ingested
- Civics
- —
Market trends
- HPI YoY
- ▼ -88.07%
- Current HPI
- 205.5664
- Rent YoY
- —
- Metro
- Chicago-Naperville-Elgin, IL-IN-WI
- State GDP YoY
- ▲ 1.59%
- F500 in state
- 60
Industry mix (Fortune 500 HQ in IL)
| Industry | F500 HQs | Revenue |
|---|---|---|
| Insurance | 4 | $201B |
|
||
| Consumer Goods | 4 | $87B |
|
||
| Industrial Machinery | 3 | $64B |
|
||
| Healthcare | 2 | $55B |
|
||
| Retail / Pharmacy | 1 | $148B |
|
||
| Agriculture / Food | 1 | $86B |
|
||
Cash-flow waterfall
monthlySold comps — $/sqft
last 12 mo · ≤1 miLoading sold comps…