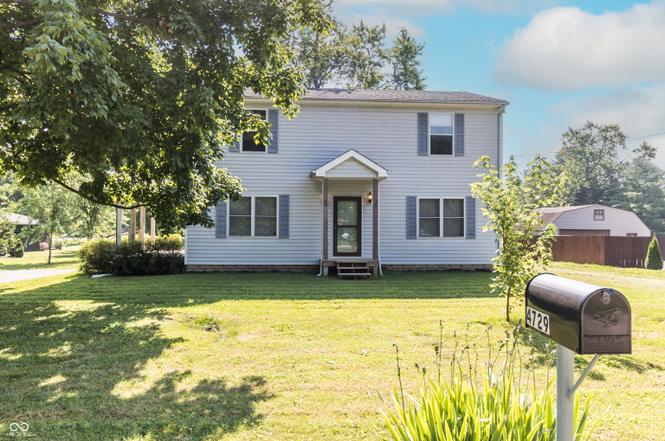
4729 Hittle Dr
Indianapolis city (balance), IN 46239
$249,999D+
3 bd · 2.0 ba ·
2,105 sqft ·
Built 1900
· SingleFamily
· Pending
· 329 DOM
Cashflow @ list (25.0% down · 7.5%)
Estimated rent
$2,083/mo
Mortgage (P&I)
−$1,311
Tax + insurance
−$304
HOA
−$0
Vac / Maint / Mgmt
−$437
Net cashflow
$31/mo
Annual
$367/yr
Cap rate
6.44%
Cash-on-cash
0.52%
DSCR
1.02
1% rule
0.83%
Cash to close
$70,000
Investor read
- This is a 3-bed/2.0-bath single-family listed at $250k.
- At list price, monthly cash flow is $31 ($367/yr) — positive.
- The deal already cash-flows at list — no discount required.
- To meet the 1% rule (rent ≥ 1% of price), the offer needs to be $208k (16.7% below list).
- It's been on market 329 days — a 12% lower offer ($220k) is reasonable based on typical stale-listing flexibility.
- Recommended offer: $208k (16.7% below list) — sets the bar for 1% rule.
- Local home prices are declining (-3.0%/yr); year-one equity from $2k of loan paydown is wiped out by about $8k of value loss. Plan a longer hold.
- Location reads: area grade D — affects rentability + tenant quality, not the cash-flow math above.
- Franklin Township Community School Corporation (urban): math 42% / reading 47% proficiency, ranked #87 of 301 in IN (top 29%) — families likely to look elsewhere, expect single-tenant / working-renter base with shorter leases.
- Zoned schools: Franklin Central High School (math 41% / reading 69%, grade C, #77 of 369 statewide, top 21%, 3,319 students, 46% FRL) — zoned schools average 46% FRL vs 29% district-wide (17 pts higher); higher-poverty schools than district average — tighter screening recommended.
- Watch-outs: built in 1900 — expect roof / HVAC / electrical / plumbing capex.
- Market conditions: Rents rising fast (+6.1%/yr); 333 active listings in the ZIP; 10 comparable units currently listed for rent nearby; rentals leasing fast (median 13d on market — plan ~1-2 weeks tenant-placement turnaround); solid renter incomes; 1,906 units permitted in Marion County in 2024 (621 in 5+ unit buildings).
- Marion County population projected at +18% by 2050 — long-run rental-demand tailwind backs the buy-and-hold thesis.
- Cap rate 6.4% vs local median 4.4% in Indianapolis city (balance) — top-decile yield for the area; either an underpriced asset or a hidden risk that comps aren't pricing in. Stress-test before assuming the spread holds.
Questions for listing agent
- It's been on market 329 days. Have you received any prior offers? Is the seller open to a 17% concession, seller financing, or rate buy-down credit?
- Built in 1900 — when were the roof, HVAC, electrical panel, plumbing, and water heater last replaced?
- Why hasn't it sold? Are there any deal-killer items the seller is aware of (foundation, flood, title, zoning, code violations)?
- Is there a deadline driving the sale (1031 exchange, divorce, estate, relocation)? That informs how much negotiation room exists.
- The area grade is low — what's the realistic commute time and amenity access for the typical tenant pool here? Any planned neighborhood developments (good or bad) we should know about?
- What's the average days-on-market for RENTAL listings here right now (not sales)? A rising rental-DOM trend means longer vacancies and softer asking-rent achievability than the comps imply.
- What's the recent tenant-quality profile in this submarket — average credit score on applications, eviction rate, late-payment / NSF rate, and stable-employment percentage? A property-management company in the area should have these aggregated.
- How much new for-sale + rental construction is in the pipeline within 1–3 miles? Heavy new supply typically softens prices + rents 12–24 months out; constrained supply supports both.
CashFlowRE · CFR-9307MC9XRPXHSB
· Data 1 week ago
cashflowre.app · 2026-05-29