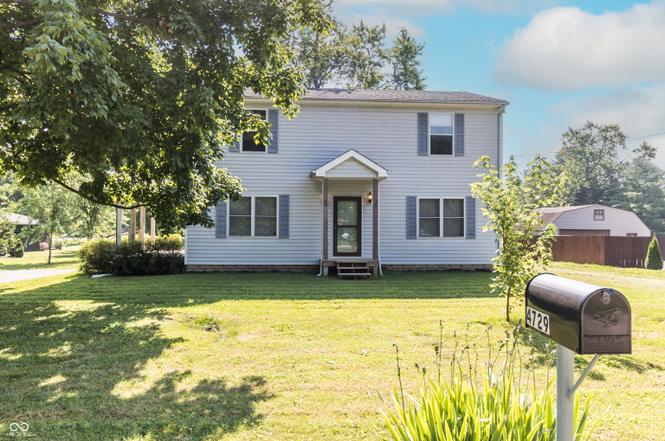
4729 Hittle Dr · Indianapolis city (balance), IN
Flood risk 1/10 · Minimal
- FEMA flood zone
- X (unshaded)
- Chance of flooding over 30 yrs
- 0.0%
- Est. flood insurance / yr
- $473 – $860
Fire risk 1/10 · Minimal
- Est. fire insurance / yr
- $717 – $1,331
Heat risk 3/10 · Minor
- Hot days now (above 101°F)
- 7 days/yr
- Hot days in 30 yrs
- 19 days/yr
Wind risk 2/10 · Minimal
- Chance of severe wind over 30 yrs
- 1.0%
Air-quality risk 2/10 · Minimal
- Unhealthy air days now
- 1 days/yr
- Unhealthy air days in 30 yrs
- 2 days/yr
Risk factors via First Street. Map © Google.
Why this score? — see what drove the D+ grade
The composite is a weighted blend of 9 inputs, each scored 0–100. Each bar is that input's sub-score; the figure is the points it added to the 100-point composite (weight × sub-score).
- ARV discount +15.0/15.0
- Cash flow +14.0/30.0
- DSCR +4.2/10.0
- Rent growth +4.0/5.0
- Schools +4.0/10.0
- 1% rule +3.3/10.0
- Livability +2.5/5.0
- Condition / age +2.5/5.0
- Appreciation +0.0/10.0
$249,999
🖨 Deal sheet 📄 Offer letter ✓ Due diligence
Listing remarks
A Rare Find in Franklin Township - Country Feel, Suburban Convenience! Welcome to your next chapter! Nestled on a beautiful . 46-acre lot in the heart of Franklin Township, this spacious 4-bedroom home offers the best of both worlds - the serenity of country living with all the conveniences of city life just minutes away. Imagine coming home to a peaceful retreat that feels worlds away from the hustle and bustle, yet remains close to shopping, dining, parks, and top-rated schools. Highlights You'll Love: -4 bedrooms with room to spread out, grow, and make it your own -A primary suite featuring an impressive 15 x 8 walk-in closet - truly a dream for anyone who loves space an
Key facts
- Primary suite
- Private piece
- Detached garage
Tags
Property features AI
Finance
- Other: Approximately 0.46-acre lot
Exterior
- Parking: Detached 3-car garage
- Utilities: Municipal sewer connected; Private water source; 200+ amp electric service; Natural gas connected; Solid waste service available
- Home design: Single family residence; Two levels
- Construction: Vinyl siding; Concrete perimeter foundation (cellar/other foundations present)
- Exterior features: Deck and porch; Fire pit; Outbuilding
Interior
- Kitchen: Electric oven
- Bedrooms: Primary bedroom with walk-in closet; Four bedrooms total (2 on main level, 2 on upper level)
- Bathrooms: Two full bathrooms total; Primary bathroom is a suite
- Heating & cooling: Natural gas heating; Central air conditioning
- Interior features: Living room fireplace; Jack-and-Jill bath configuration; Bedroom on main level
- Laundry & utility: Washer and dryer (connections provided); Electric water heater
Neighborhood map
What this means for you Summary
Snapshot
- This is a 3-bed/2.0-bath single-family listed at $250k.
Deal economics
- At list price, monthly cash flow is $31 ($367/yr) — positive.
- The deal already cash-flows at list — no discount required.
- To meet the 1% rule (rent ≥ 1% of price), the offer needs to be $208k (16.7% below list).
- Recommended offer: $208k (16.7% below list) — sets the bar for 1% rule.
- Cap rate 6.4% vs local median 4.4% in Indianapolis city (balance) — top-decile yield for the area; either an underpriced asset or a hidden risk that comps aren't pricing in. Stress-test before assuming the spread holds.
Location & tenants
- Location reads: area grade D — affects rentability + tenant quality, not the cash-flow math above.
- Franklin Township Community School Corporation (urban): math 42% / reading 47% proficiency, ranked #87 of 301 in IN (top 29%) — families likely to look elsewhere, expect single-tenant / working-renter base with shorter leases.
- Zoned schools: Franklin Central High School (math 41% / reading 69%, grade C, #77 of 369 statewide, top 21%, 3,319 students, 46% FRL) — zoned schools average 46% FRL vs 29% district-wide (17 pts higher); higher-poverty schools than district average — tighter screening recommended.
- Market conditions: Rents rising fast (+6.1%/yr); 333 active listings in the ZIP; 10 comparable units currently listed for rent nearby; rentals leasing fast (median 12d on market — plan ~1-2 weeks tenant-placement turnaround); solid renter incomes; 1,906 units permitted in Marion County in 2024 (621 in 5+ unit buildings).
Forward outlook
- Local home prices are declining (-3.0%/yr); year-one equity from $2k of loan paydown is wiped out by about $8k of value loss. Plan a longer hold.
- Marion County population projected at +18% by 2050 — long-run rental-demand tailwind backs the buy-and-hold thesis.
Negotiation context
- It's been on market 329 days — a 12% lower offer ($220k) is reasonable based on typical stale-listing flexibility.
Risks & watch-outs
- Watch-outs: built in 1900 — expect roof / HVAC / electrical / plumbing capex.
Questions for the listing agent
- It's been on market 329 days. Have you received any prior offers? Is the seller open to a 17% concession, seller financing, or rate buy-down credit?
- Built in 1900 — when were the roof, HVAC, electrical panel, plumbing, and water heater last replaced?
- Why hasn't it sold? Are there any deal-killer items the seller is aware of (foundation, flood, title, zoning, code violations)?
- Is there a deadline driving the sale (1031 exchange, divorce, estate, relocation)? That informs how much negotiation room exists.
- The area grade is low — what's the realistic commute time and amenity access for the typical tenant pool here? Any planned neighborhood developments (good or bad) we should know about?
- What's the average days-on-market for RENTAL listings here right now (not sales)? A rising rental-DOM trend means longer vacancies and softer asking-rent achievability than the comps imply.
- What's the recent tenant-quality profile in this submarket — average credit score on applications, eviction rate, late-payment / NSF rate, and stable-employment percentage? A property-management company in the area should have these aggregated.
- How much new for-sale + rental construction is in the pipeline within 1–3 miles? Heavy new supply typically softens prices + rents 12–24 months out; constrained supply supports both.
Investment metrics
- 1% rule
- 0.83% ✗
- Cap rate
- 6.44%
- Cash-on-cash
- 0.52%
- DSCR
- 1.02
- GRM
- 10.0
CMA / ARV
- ARV (on-the-fly)
- $317,855
- Comps found
- 12
Show comp detail 12 sales within ~0.75 mi
| Address | Dist | Beds/Ba | Sqft | Sold | Price | $/sf | Match |
|---|---|---|---|---|---|---|---|
| 5150 Hickory Rd | 0.55mi | 3/1.5 | 2,193 (+4%) | 1mo | $388,000 | $177 | 65 |
| 9125 Imperial Dr | 0.33mi | 3/2.0 | 2,352 (+12%) | 5mo | $255,000 | $108 | 61 |
| 9731 Violet Cir | 0.54mi | 3/2.5 | 2,006 (-5%) | 6mo | $325,000 | $162 | 60 |
| 8735 Carver Dr | 0.67mi | 4/2.5 (+1) | 2,095 (-0%) | 3mo | $349,900 | $167 | 59 |
| 9234 Fitzgerald Dr | 0.48mi | 4/2.5 (+1) | 2,346 (+11%) | 0mo | $354,900 | $151 | 51 |
| 9202 Hemingway Dr | 0.45mi | 4/2.5 (+1) | 2,346 (+11%) | 4mo | $336,285 | $143 | 49 |
| 9238 Hemingway Dr | 0.46mi | 4/2.5 (+1) | 2,346 (+11%) | 5mo | $341,900 | $146 | 49 |
| 9334 Hemingway Dr | 0.50mi | 4/2.5 (+1) | 2,346 (+11%) | 5mo | $330,900 | $141 | 47 |
| 9346 Hemingway Dr | 0.51mi | 4/2.5 (+1) | 2,346 (+11%) | 6mo | $329,900 | $141 | 45 |
| 9408 Hemingway Dr | 0.52mi | 4/2.5 (+1) | 2,346 (+11%) | 6mo | $353,950 | $151 | 45 |
| 5228 Cartland Dr | 0.47mi | 4/2.5 (+1) | 2,346 (+11%) | 9mo | $367,900 | $157 | 44 |
| 8866 Twain Ln | 0.71mi | 2/2.0 (-1) | 1,950 (-7%) | 9mo | $313,400 | $161 | 42 |
Match score weights: distance 35% · size 25% · config 20% · recency 20%. Top-matched comps best support the ARV.
Projected returns pro-forma
-3.0% appreciation · 6.11% rent growth · sell at horizon
- IRR
- -12.3%
- Equity multiple
- 0.54×
- Total profit
- $-31,878
- Equity at exit
- $37,276
- IRR
- 0.7%
- Equity multiple
- 1.06×
- Total profit
- $3,997
- Equity at exit
- $21,615
Cash invested: $70,000 (down + closing). Projections, not guarantees.
Landlord ↔ Tenant lean methodology
- Overall (STATE)
- 90 Strongly Landlord-Friendly
- State Indiana
- 90 Strongly Landlord-Friendly · R+11
- County
- — inherits STATE
- City
- — inherits STATE
ZIP-level market 46239
- Home prices YoY
- -29.2%
- Rents YoY
- 6.1%
- Active inventory
- 333
- Price-to-rent
- 10.0×
Monthly cashflow live
- Estimated rent
- $2,083 high interval (Pro) →
- Mortgage (P&I)
- −$1,311
- Tax from tax record
- −$200 /mo · $2,397/yr
- Insurance
- −$104
- HOA
- −$0
- Vacancy / Maint / Mgmt
- −$437
- Net cashflow
- $31
Break-even live
UW: 25.0% down · 7.5% · 30yr · 1.5% tax · 5.0% vac · 8.0% maint · 8.0% mgmt
Financing live
Cash to close
- Down payment
- $62,500
- Closing costs
- $7,500
- Reserves months
- —
- Total cash needed
- —
Loan-product check · same deal, 3 products live
Conventional
25% down · 7.5% · 30yr
- Down + closing
- —
- Monthly P&I
- —
- Monthly cashflow
- —
- DSCR
- —
- Eligible?
- —
Personal DTI + credit; lowest rate.
DSCR
20% down · 8.5% · 30yr
- Down + closing
- —
- Monthly P&I
- —
- Monthly cashflow
- —
- DSCR
- —
- Eligible?
- —
No personal income docs; deal must DSCR.
Hard money
10% down · 12.0% · 12mo
- Down + closing
- —
- Monthly P&I
- —
- Monthly cashflow
- —
- DSCR
- —
- Eligible?
- —
Short-term bridge; refi at stabilization.
Rent comps 10 comps
| Address | Beds | Baths | Sqft | Rent | $/sqft | DOM | Units | Dist |
|---|---|---|---|---|---|---|---|---|
| 9237 Kavanaugh Dr Indianapolis, IN | 3.0 | 2.0 | 1503 | $2,200 | $1.46 | 17d | 1 | 0.37mi |
| 8836 Kipling Dr Indianapolis, IN | 4.0 | 2.5 | 1686 | $2,200 | $1.30 | 23d | 1 | 0.52mi |
| 4127 S Post Rd Indianapolis, IN | 3.0 | 2.0 | 1460 | $1,585 | $1.09 | 23d | 1 | 0.71mi |
| 4146 Palermo Garden Indianapolis, IN | 3.0 | 2.0 | 1790 | $2,100 | $1.17 | 1d | 1 | 0.90mi |
| 10166 Southeastern Ave Indianapolis, IN | 2.0 | 1.5 | 1625 | $1,295 | $0.80 | 23d | 1 | 1.03mi |
| 4526 Wild Turkey Dr Indianapolis, IN | 4.0 | 2.5 | 1880 | $1,950 | $1.04 | 7d | 1 | 1.18mi |
| 4225 Tiana Cir Indianapolis, IN | 3.0 | 2.0 | 1946 | $2,071 | $1.06 | 12d | 1 | 1.19mi |
| 5602 Wild Horse Dr Indianapolis, IN | 3.0 | 2.0 | 1616 | $1,911 | $1.18 | 7d | 1 | 1.37mi |
| 5330 Himalayan Dr Indianapolis, IN | 3.0 | 2.5 | 2120 | $2,179 | $1.03 | 4d | 1 | 1.37mi |
| 8051 Little River Ln Indianapolis, IN | 3.0 | 2.5 | 2135 | $1,801 | $0.84 | 7d | 1 | 1.48mi |
Listing history 12 events
-
2026-06-07statusdays on market $249,999 Pending 329 DOM
-
2026-06-03days on market $249,999 Active 328 DOM
-
2026-06-02days on market $249,999 Active 327 DOM
-
2026-06-01days on market $249,999 Active 326 DOM
-
2026-05-31days on market $249,999 Active 325 DOM
-
2026-05-17price $249,999
-
2026-04-19price $265,000
-
2026-03-31price $275,000
-
2026-01-16price $280,000
-
2025-11-19price $285,000
-
2025-08-21price $289,000
-
2025-07-10$295,000 Active
ⓘ Source: listings_history table (triggers on properties + properties_extension) + one-shot
backfill from property_details.listing_events for pre-trigger history.
Tax reassessment forecast IN · Partial reset (capped growth)
- Current annual tax
- $2,397 · $200/mo
- Projected year-2 tax
- $2,397 · $200/mo
- Expected delta
- $0/yr ($0/mo · 0.0%)
ⓘ Screening estimate from a state-policy table — verify with the county assessor before closing.
Climate risk First Street
- Flood 1/10 Low FEMA zone X (unshaded) · 0% chance over 30 yrs
- Wildfire 1/10 Low
- Heat 3/10 Moderate 7 d/yr ≥101°F today · 19 d/yr by 30 yrs out
- Wind 2/10 Low 100% chance of damaging wind over 30 yrs
- Air quality 2/10 Low 1 unhealthy d/yr today · 2 by 30 yrs out
Nearby sold comps map
Loading sold comps map…
Walkable amenities ~0.75 mi
Loading nearby amenities…
Taxation est. · year 1
- Rental income
- $24,996
- − Mortgage interest
- −$14,004
- − Property taxes
- −$2,397
- − Insurance
- −$1,250
- − Repairs & maintenance
- −$2,000
- − Management
- −$2,000
- − Depreciation
- −$7,273
- Taxable loss
- −$3,927
- Est. tax savings @ 24.0%
- +$943
- After-tax cash flow
- $1,310/yr
For passive investors: Depreciation is non-cash, so a rental often shows a tax loss while cash-flowing — sheltering income. Rental losses are passive: they offset passive income freely, and up to $25,000/yr can offset ordinary (W-2) income if you actively participate and your MAGI is under $100k (phasing out to $0 by $150k); unused losses carry forward. On sale, claimed depreciation is recaptured at up to 25%, and gains may owe capital-gains tax (a 1031 exchange can defer both). Figures are a year-1 estimate at your 24.0% rate — not tax advice; consult a CPA.
Schools (NCES district)
- District
- Franklin Township Community School Corporation
- NCES district ID
- 1803750
- Math proficiency
- 42% ▼ -12.00%
- Reading proficiency
- 47% ▼ -6.00%
- Median HH income
- $67,825
- Composite
- 39.91/100
- National rank
- #3852
- State rank
- #87 of 301 in IN
Livability — Indianapolis city (balance)
No livability data for this city. (Only ~50 U.S. cities are tracked.)
Census & demographics
- Census place
- Indianapolis city (balance), IN
- County
- Marion County · 998,460 people
- City population
- 881,119
- Metro
- Indianapolis-Carmel-Anderson, IN
- Population (ZIP)
- 33,931
- Household income
- $100,331
- Rent vs Own
- Severe rent burden
- 567.0
Population outlook (Marion County) Hauer SSP2
- Today (2025)
- 1,025,572 people
- By 2030
- 1,065,727 · +3.9%
- By 2040
- 1,141,577 · +11.3%
- By 2050
- 1,208,920 · +17.9%
- By 2075
- 1,367,288 · +33.3%
- By 2100
- 1,438,201 · +40.2%
Race, ethnicity, and origin ACS 2023
- Neighborhood character
- Diverse neighborhood (Simpson 0.61)
- Race & ethnicity
- White 57% Black 24% Hispanic / Latino 9% Two or more races 9% Asian 4%
- Hispanic origin (detail)
- Mexican 6%
- Common ancestry
- Lithuanian 2% Slovak 2% Romanian 1%
- Foreign-born
- 7% · Canada, Philippines, China
- Languages at home
- 89% English-only · Spanish 6% Other Indo-European 2% Chinese 1%
Political lean MEDSL · Marion
- 2024 margin
- Strong D (+27.7) · D 63.0% · R 35.3% · Other 1.7%
- 2008→2024 swing
- -0.7pp no change · 2008: 28.4pp · 2024: 27.7pp
- All cycles
- 2024: D+27.7 2020: D+29.1 2016: D+22.8 2012: D+22.2 2008: D+28.4
Not yet ingested
- Civics
- —
Market trends
- HPI YoY
- ▼ -93.15%
- Current HPI
- 226.1965
- Rent YoY
- ▲ 6.11%
- Metro
- Indianapolis-Carmel-Anderson, IN
- State GDP YoY
- ▲ 2.90%
- F500 in state
- 18
Industry mix (Fortune 500 HQ in IN)
| Industry | F500 HQs | Revenue |
|---|---|---|
| Industrial Machinery | 2 | $37B |
|
||
| Healthcare | 1 | $177B |
|
||
| Pharmaceuticals | 1 | $45B |
|
||
| Metals / Steel | 1 | $18B |
|
||
| Agriculture | 1 | $17B |
|
||
| Packaging | 1 | $12B |
|
||
Price history
-15.3% since first listed7 events — show timeline
- 2026-05-17 Price Changed $249,999 MIBOR as Distributed by MLS Grid
- 2026-04-19 Price Changed $265,000 MIBOR as Distributed by MLS Grid
- 2026-03-31 Price Changed $275,000 MIBOR as Distributed by MLS Grid
- 2026-01-16 Price Changed $280,000 MIBOR as Distributed by MLS Grid
- 2025-11-19 Price Changed $285,000 MIBOR as Distributed by MLS Grid
- 2025-08-21 Price Changed $289,000 MIBOR as Distributed by MLS Grid
- 2025-07-10 Listed $295,000 MIBOR as Distributed by MLS Grid
Property tax history
+5.6%/yrLatest (2025): $2,397 · -4.2% YoY. Source: county tax records.
Cash-flow waterfall
monthlySold comps — $/sqft
last 12 mo · ≤1 miLoading sold comps…