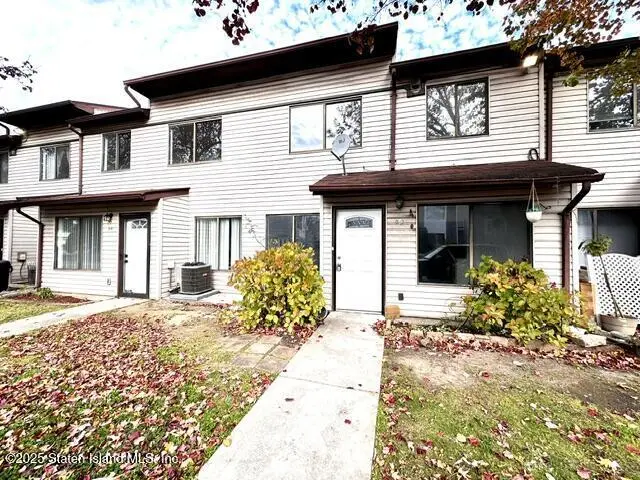
92 Wolkoff Ln
New York, NY 10303
$439,000D
3 bd · 2.5 ba ·
999 sqft ·
Built 1985
· Condo
· Active
· 30 DOM
Cashflow @ list (25.0% down · 7.5%)
Estimated rent
$3,378/mo
Mortgage (P&I)
−$2,302
Tax + insurance
−$416
HOA
−$0
Vac / Maint / Mgmt
−$709
Net cashflow
$-50/mo
Annual
$-596/yr
Cap rate
6.16%
Cash-on-cash
-0.49%
DSCR
0.98
1% rule
0.77%
Cash to close
$122,920
Investor read
- This is a 3-bed/2.5-bath condo listed at $439k.
- At list price, monthly cash flow is $-50 ($-596/yr) — negative.
- To cash-flow at today's rent, offer at most $430k (2.0% below list).
- To meet the 1% rule (rent ≥ 1% of price), the offer needs to be $338k (23.0% below list).
- It's been on market 30 days — a 2% lower offer ($432k) is reasonable based on typical stale-listing flexibility.
- Recommended offer: $338k (23.0% below list) — sets the bar for 1% rule.
- Local home prices are declining (-3.0%/yr); year-one equity from $3k of loan paydown is wiped out by about $13k of value loss. Plan a longer hold.
- Location reads 75/100 on livability (#268 in NY, #4,188 nationally) — a middle-class / working-renter tenant base. Strengths: amenities A+, commute A+, health & safety A; Watch: crime F, cost of living F.
- Market conditions: 108 active listings in the ZIP; 1 comparable units currently listed for rent nearby; solid renter incomes; 480 units permitted in Richmond County in 2024 (22 in 5+ unit buildings).
- Richmond County population projected to shrink 5% by 2050 — rents likely to lag national; underwrite the cash flow, not the appreciation.
- 5 sale attempts since 30y ago with the ask held roughly flat each time — persistent listings suggest the price (not the market) is what's stuck; bring a comps-based counter.
- Current owner paid $126k; list at $439k implies a 248% gain — meaningful room to come down on a strong offer.
- Climate carrying-cost: major wind risk, 52% chance of damaging wind over 30y; extreme-heat days projected 7→15/yr by 2055 (HVAC capex compounding) — expect insurance premiums to compound above CPI over the hold.
- Cap rate 6.2% vs local median 2.6% in New York — top-decile yield for the area; either an underpriced asset or a hidden risk that comps aren't pricing in. Stress-test before assuming the spread holds.
- At $3,378/mo this rent would consume 48% of the median local household income ($84k/yr) (locally 1198% of renters already pay >50% of income on rent) — very limited rent-growth headroom before tenants either downsize or default.
Questions for listing agent
- What do current leases actually rent for vs. the listed asking? Can we see a recent rent roll and the last 12 months of T-12 income?
- Any open or pending special assessments — roof, HVAC, plumbing, elevator, façade? What's the per-unit balance and payoff schedule, and is the seller paying it off at close or rolling it to the buyer?
- Is there a deadline driving the sale (1031 exchange, divorce, estate, relocation)? That informs how much negotiation room exists.
- Schools are B-rated — typically a magnet for longer-tenancy family renters. What's the average tenant stay here, and is there a school-zone premium baked into asking?
- Crime grade is F in this area — have there been break-ins, vandalism, or insurance claims at this property in the last 3 years? What carrier currently insures it and at what premium?
- The area grade is low — what's the realistic commute time and amenity access for the typical tenant pool here? Any planned neighborhood developments (good or bad) we should know about?
- What's the average days-on-market for RENTAL listings here right now (not sales)? A rising rental-DOM trend means longer vacancies and softer asking-rent achievability than the comps imply.
- What's the recent tenant-quality profile in this submarket — average credit score on applications, eviction rate, late-payment / NSF rate, and stable-employment percentage? A property-management company in the area should have these aggregated.
CashFlowRE · CFR-950T7FCMMYXDF7
· Data 2 days ago
cashflowre.app · 2026-05-29