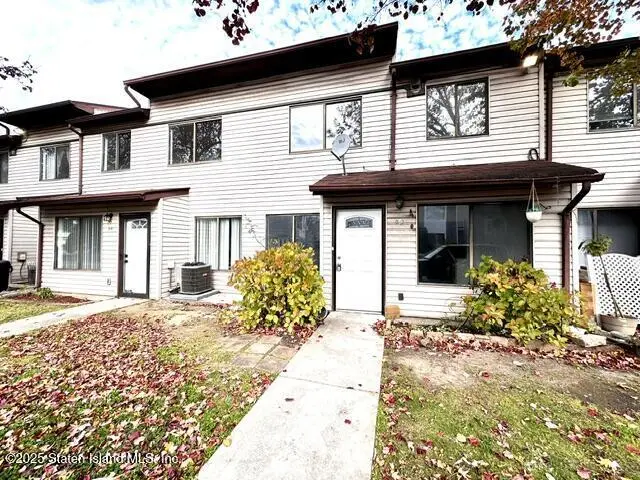
92 Wolkoff Ln · New York, NY
Flood risk 1/10 · Minimal
- FEMA flood zone
- X (shaded)
- Chance of flooding over 30 yrs
- 0.0%
- Est. flood insurance / yr
- $507 – $1,088
Fire risk 1/10 · Minimal
- Est. fire insurance / yr
- $691 – $1,283
Heat risk 7/10 · Major
- Hot days now (above 98°F)
- 7 days/yr
- Hot days in 30 yrs
- 15 days/yr
Wind risk 6/10 · Moderate
- Chance of severe wind over 30 yrs
- 52.0%
Air-quality risk 4/10 · Minor
- Unhealthy air days now
- 5 days/yr
- Unhealthy air days in 30 yrs
- 6 days/yr
Risk factors via First Street. Map © Google.
Why this score? — see what drove the D grade
The composite is a weighted blend of 9 inputs, each scored 0–100. Each bar is that input's sub-score; the figure is the points it added to the 100-point composite (weight × sub-score).
- Cash flow +12.7/30.0
- ARV discount +7.5/15.0
- Schools +5.0/10.0
- DSCR +3.8/10.0
- Livability +3.8/5.0
- 1% rule +2.7/10.0
- Rent growth +2.5/5.0
- Condition / age +2.5/5.0
- Appreciation +0.0/10.0
$439,000
🖨 Deal sheet 📄 Offer letter ✓ Due diligence
Listing remarks
Stunning 3-Bedroom Condo with Spacious Finished Attic-Welcome to this beautifully maintained 3-bedroom, 2.5 bath condo, offering the perfect blend of comfort, style, and extra living space. Located in a desirable neighborhood, this home features an open-concept layout filled with natural light, modern finishes, and plenty of room to grow. A standout feature of this property is the fully finished attic which currently is used the 3rd bedroom with a full bathroom. It can be converted to a family room, home office, playroom, gym, or guest suite. Its versatility makes it a valuable extension of your living space. Whether you're a first-time buyer, downsizing, or seeking extra space for work or
Key facts
- Finished attic
- Natural light
- Modern finishes
Tags
Property features AI
Finance
- Other: Taxes listed (amount not included per instructions)
- HOA & community: Association (CMA) with monthly dues; Community amenities include clubhouse, playground and pool; Association fees cover snow removal, exterior maintenance and clubhouse
Exterior
- Parking: Assigned parking
- Utilities: 220-volt electric service
- Home design: 3-story building; Approximate 2025 construction
- Construction: Vinyl siding; Built around 2025
- Exterior features: In-ground pool; Lot about 3.09 acres; Lot dimensions roughly 20 x 42; Zoned R3-2
Interior
- Kitchen: Dishwasher; Microwave; Refrigerator; Gas or electric range (stove not explicitly specified)
- Bathrooms: 2 full bathrooms; 1 half bathroom
- Heating & cooling: Natural gas heating; Forced air heating; Has heating; Has cooling
- Interior features: Central air conditioning; Excellent property condition
- Laundry & utility: Washer; Dryer
Neighborhood map
What this means for you Summary
Snapshot
- This is a 3-bed/2.5-bath condo listed at $439k.
Deal economics
- At list price, monthly cash flow is $-50 ($-596/yr) — negative.
- To cash-flow at today's rent, offer at most $430k (2.0% below list).
- To meet the 1% rule (rent ≥ 1% of price), the offer needs to be $338k (23.0% below list).
- Recommended offer: $338k (23.0% below list) — sets the bar for 1% rule.
- Cap rate 6.2% vs local median 2.6% in New York — top-decile yield for the area; either an underpriced asset or a hidden risk that comps aren't pricing in. Stress-test before assuming the spread holds.
Location & tenants
- Location reads 75/100 on livability (#268 in NY, #4,188 nationally) — a middle-class / working-renter tenant base. Strengths: amenities A+, commute A+, health & safety A; Watch: crime F, cost of living F.
- Market conditions: 108 active listings in the ZIP; 1 comparable units currently listed for rent nearby; solid renter incomes; 480 units permitted in Richmond County in 2024 (22 in 5+ unit buildings).
- At $3,378/mo this rent would consume 48% of the median local household income ($84k/yr) (locally 1198% of renters already pay >50% of income on rent) — very limited rent-growth headroom before tenants either downsize or default.
Forward outlook
- Local home prices are declining (-3.0%/yr); year-one equity from $3k of loan paydown is wiped out by about $13k of value loss. Plan a longer hold.
- Richmond County population projected to shrink 5% by 2050 — rents likely to lag national; underwrite the cash flow, not the appreciation.
Negotiation context
- It's been on market 30 days — a 2% lower offer ($432k) is reasonable based on typical stale-listing flexibility.
- 5 sale attempts since 30y ago with the ask held roughly flat each time — persistent listings suggest the price (not the market) is what's stuck; bring a comps-based counter.
- Current owner paid $126k; list at $439k implies a 248% gain — meaningful room to come down on a strong offer.
Risks & watch-outs
- Climate carrying-cost: major wind risk, 52% chance of damaging wind over 30y; extreme-heat days projected 7→15/yr by 2055 (HVAC capex compounding) — expect insurance premiums to compound above CPI over the hold.
Questions for the listing agent
- What do current leases actually rent for vs. the listed asking? Can we see a recent rent roll and the last 12 months of T-12 income?
- Any open or pending special assessments — roof, HVAC, plumbing, elevator, façade? What's the per-unit balance and payoff schedule, and is the seller paying it off at close or rolling it to the buyer?
- Is there a deadline driving the sale (1031 exchange, divorce, estate, relocation)? That informs how much negotiation room exists.
- Schools are B-rated — typically a magnet for longer-tenancy family renters. What's the average tenant stay here, and is there a school-zone premium baked into asking?
- Crime grade is F in this area — have there been break-ins, vandalism, or insurance claims at this property in the last 3 years? What carrier currently insures it and at what premium?
- The area grade is low — what's the realistic commute time and amenity access for the typical tenant pool here? Any planned neighborhood developments (good or bad) we should know about?
- What's the average days-on-market for RENTAL listings here right now (not sales)? A rising rental-DOM trend means longer vacancies and softer asking-rent achievability than the comps imply.
- What's the recent tenant-quality profile in this submarket — average credit score on applications, eviction rate, late-payment / NSF rate, and stable-employment percentage? A property-management company in the area should have these aggregated.
- How much new apartment / multifamily construction is in the pipeline within 1–3 miles? Heavy new supply (>2% of stock underway) typically softens rents 12–24 months out; light construction supports rent growth.
Investment metrics
- 1% rule
- 0.77% ✗
- Cap rate
- 6.16%
- Cash-on-cash
- -0.49%
- DSCR
- 0.98
- GRM
- 10.8
CMA / ARV
No comps found within radius.
Projected returns pro-forma
-3.0% appreciation · 3.0% rent growth · sell at horizon
- IRR
- -17.1%
- Equity multiple
- 0.39×
- Total profit
- $-74,445
- Equity at exit
- $65,456
- IRR
- -9.2%
- Equity multiple
- 0.43×
- Total profit
- $-69,481
- Equity at exit
- $37,957
Cash invested: $122,920 (down + closing). Projections, not guarantees.
Landlord ↔ Tenant lean methodology
- Overall (CITY)
- 0 Strongly Tenant-Friendly
- State New York
- 15 Strongly Tenant-Friendly · D+10
- County
- — inherits STATE
- City New York
- 0 Strongly Tenant-Friendly · D+34
ZIP-level market 10303
- Home prices YoY
- -24.8%
- Active inventory
- 108
- Price-to-rent
- 10.8×
Monthly cashflow live
- Estimated rent
- $3,378 medium interval (Pro) →
- Mortgage (P&I)
- −$2,302
- Tax from tax record
- −$233 /mo · $2,802/yr
- Insurance
- −$183
- HOA
- −$0
- Vacancy / Maint / Mgmt
- −$709
- Net cashflow
- $-50
Break-even live
UW: 25.0% down · 7.5% · 30yr · 1.5% tax · 5.0% vac · 8.0% maint · 8.0% mgmt
Financing live
Cash to close
- Down payment
- $109,750
- Closing costs
- $13,170
- Reserves months
- —
- Total cash needed
- —
Loan-product check · same deal, 3 products live
Conventional
25% down · 7.5% · 30yr
- Down + closing
- —
- Monthly P&I
- —
- Monthly cashflow
- —
- DSCR
- —
- Eligible?
- —
Personal DTI + credit; lowest rate.
DSCR
20% down · 8.5% · 30yr
- Down + closing
- —
- Monthly P&I
- —
- Monthly cashflow
- —
- DSCR
- —
- Eligible?
- —
No personal income docs; deal must DSCR.
Hard money
10% down · 12.0% · 12mo
- Down + closing
- —
- Monthly P&I
- —
- Monthly cashflow
- —
- DSCR
- —
- Eligible?
- —
Short-term bridge; refi at stabilization.
Rent comps 1 comps
| Address | Beds | Baths | Sqft | Rent | $/sqft | DOM | Units | Dist |
|---|---|---|---|---|---|---|---|---|
| 527 Willowbrook Rd Staten Island, NY | 3.0 | 2.0 | 1000 | $4,000 | $4.00 | 2d | 1 | 1.32mi |
HOA detail condo
- Monthly dues
- $0 · $0/yr
- Likely covers
- gym
- Assessments
- None detected in remarks — confirm with the listing agent.
Listing history 25 events
-
2026-06-18days on market $439,000 Active 30 DOM
-
2026-06-17days on market $439,000 Active 29 DOM
-
2026-06-16days on market $439,000 Active 28 DOM
-
2026-06-15days on market $439,000 Active 27 DOM
-
2026-06-13days on market $439,000 Active 25 DOM
-
2026-06-10days on market $439,000 Active 21 DOM
-
2026-06-08days on market $439,000 Active 20 DOM
-
2026-06-08days on market $439,000 Active 19 DOM
-
2026-06-04days on market $439,000 Active 16 DOM
-
2026-06-03days on market $439,000 Active 15 DOM
-
2026-06-02days on market $439,000 Active 14 DOM
-
2026-06-01days on market $439,000 Active 13 DOM
-
2026-05-31days on market $439,000 Active 12 DOM
-
2026-05-18$439,000 Active
-
2026-05-15historical
-
2025-11-19$450,000 Active
-
2016-02-17historical
-
2000-11-15soldstatus $126,000
-
2000-10-19soldstatus $124,900
-
2000-06-06$124,900
-
1998-03-12soldstatus $59,000
-
1997-09-30$63,900
-
1996-05-06$79,900
-
1990-08-16soldstatus $116,000
-
1987-02-27soldstatus $126,750
ⓘ Source: listings_history table (triggers on properties + properties_extension) + one-shot
backfill from property_details.listing_events for pre-trigger history.
Tax reassessment forecast NY · Partial reset (capped growth)
- Current annual tax
- $2,802 · $233/mo
- Projected year-2 tax
- $5,110 · $426/mo
- Expected delta
- +$2,309/yr (+$192/mo · 82.4%)
ⓘ Screening estimate from a state-policy table — verify with the county assessor before closing.
Climate risk First Street
- Flood 1/10 Low FEMA zone X (shaded) · 0% chance over 30 yrs
- Wildfire 1/10 Low
- Heat 7/10 Severe 7 d/yr ≥98°F today · 15 d/yr by 30 yrs out
- Wind 6/10 Major 52% chance of damaging wind over 30 yrs
- Air quality 4/10 Moderate 5 unhealthy d/yr today · 6 by 30 yrs out
Nearby sold comps map
Loading sold comps map…
Walkable amenities ~0.75 mi
Loading nearby amenities…
Taxation est. · year 1
- Rental income
- $40,540
- − Mortgage interest
- −$24,591
- − Property taxes
- −$2,802
- − Insurance
- −$2,195
- − Repairs & maintenance
- −$3,243
- − Management
- −$3,243
- − Depreciation
- −$12,771
- Taxable loss
- −$8,305
- Est. tax savings @ 24.0%
- +$1,993
- After-tax cash flow
- $1,397/yr
For passive investors: Depreciation is non-cash, so a rental often shows a tax loss while cash-flowing — sheltering income. Rental losses are passive: they offset passive income freely, and up to $25,000/yr can offset ordinary (W-2) income if you actively participate and your MAGI is under $100k (phasing out to $0 by $150k); unused losses carry forward. On sale, claimed depreciation is recaptured at up to 25%, and gains may owe capital-gains tax (a 1031 exchange can defer both). Figures are a year-1 estimate at your 24.0% rate — not tax advice; consult a CPA.
Schools (NCES district)
No district data.
Livability — New York
- Score
- 75/100
- State rank
- #268
- US rank
- #4188
Category grades
Schools grade is shown separately in the Schools card above.
Census & demographics
- Census place
- New York, NY
- County
- Richmond County · 404,174 people
- City population
- 7,731,280
- Metro
- New York-Newark-Jersey City, NY-NJ-PA
- Population (ZIP)
- 26,497
- Household income
- $83,947
- Rent vs Own
- Severe rent burden
- 1198.0
Population outlook (Richmond County) Hauer SSP2
- Today (2025)
- 482,784 people
- By 2030
- 481,831 · -0.2%
- By 2040
- 473,159 · -2.0%
- By 2050
- 457,242 · -5.3%
- By 2075
- 408,029 · -15.5%
- By 2100
- 341,459 · -29.3%
Race, ethnicity, and origin ACS 2023
- Neighborhood character
- Highly diverse neighborhood (Simpson 0.72)
- Race & ethnicity
- Hispanic / Latino 38% Black 33% Two or more races 17% White 15% Asian 10%
- Hispanic origin (detail)
- Mexican 5% Puerto Rican 19% Dominican 5%
- Common ancestry
- Romanian 2% Italian 1% Swiss 1%
- Foreign-born
- 26% · Canada, China, Jamaica
- Languages at home
- 57% English-only · Spanish 25% Other Indo-European 6% Chinese 3%
Political lean MEDSL · Richmond
- 2024 margin
- Strong R (+29.8) · D 35.1% · R 64.9%
- 2008→2024 swing
- -25.7pp toward R · 2008: -4.0pp · 2024: -29.8pp
- All cycles
- 2024: R+29.8 2020: R+14.9 2016: R+16.8 2012: D+0.8 2008: R+4.0
Not yet ingested
- Civics
- —
Market trends
- HPI YoY
- ▼ -121.86%
- Current HPI
- 369.2771
- Rent YoY
- —
- Metro
- New York-Newark-Jersey City, NY-NJ-PA
- State GDP YoY
- ▲ 2.60%
- F500 in state
- 92
Industry mix (Fortune 500 HQ in NY)
| Industry | F500 HQs | Revenue |
|---|---|---|
| Financial Services | 10 | $950B |
|
||
| Consumer Goods | 9 | $162B |
|
||
| Insurance | 4 | $225B |
|
||
| Telecommunications | 2 | $144B |
|
||
| Pharmaceuticals | 2 | $112B |
|
||
| Media / Entertainment | 2 | $69B |
|
||
Price history
+246.4% since first listed12 events — show timeline
- 2026-05-18 Listed $439,000 SIBORMLS
- 2026-05-15 Listing Removed — SIBORMLS
- 2025-11-19 Listed $450,000 SIBORMLS
- 2016-02-17 Listing Removed — SIBORMLS
- 2000-11-15 Sold (Public Records) $126,000 Public Records
- 2000-10-19 Sold (MLS) $124,900 SIBORMLS
- 2000-06-06 Listed $124,900 SIBORMLS
- 1998-03-12 Sold (MLS) $59,000 SIBORMLS
- 1997-09-30 Listed $63,900 SIBORMLS
- 1996-05-06 Listed $79,900 SIBORMLS
- 1990-08-16 Sold (Public Records) $116,000 Public Records
- 1987-02-27 Sold (Public Records) $126,750 Public Records
Property tax history
+6.1%/yrLatest (2025): $2,802 · +1.9% YoY. Source: county tax records.
Cash-flow waterfall
monthlySold comps — $/sqft
last 12 mo · ≤1 miLoading sold comps…