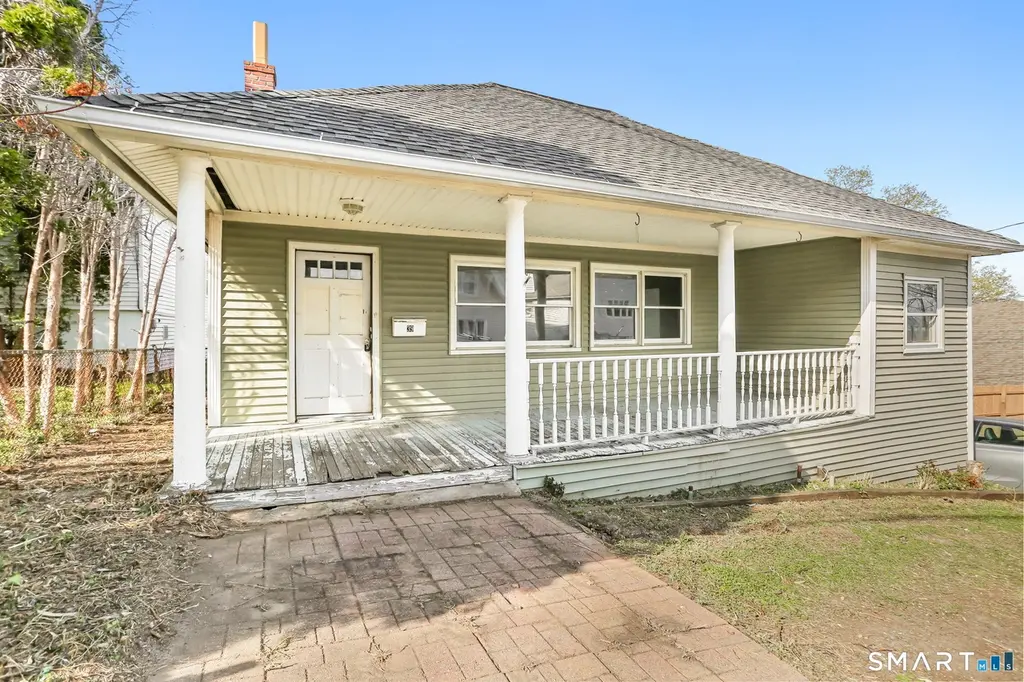
39 Soundview Ave
Milford city (balance), CT 06460
$345,000D
3 bd · 1.0 ba ·
1,157 sqft ·
Built 1930
· SingleFamily
· Under Contract
· 49 DOM
Cashflow @ list (25.0% down · 7.5%)
Estimated rent
$2,707/mo
Mortgage (P&I)
−$1,809
Tax + insurance
−$570
HOA
−$0
Vac / Maint / Mgmt
−$568
Net cashflow
$-241/mo
Annual
$-2,888/yr
Cap rate
5.46%
Cash-on-cash
-2.99%
DSCR
0.87
1% rule
0.78%
Cash to close
$96,600
Investor read
- This is a 3-bed/1.0-bath single-family listed at $345k.
- At list price, monthly cash flow is $-241 ($-3k/yr) — negative.
- To cash-flow at today's rent, offer at most $302k (12.3% below list).
- To meet the 1% rule (rent ≥ 1% of price), the offer needs to be $271k (21.5% below list).
- It's been on market 49 days — a 3% lower offer ($335k) is reasonable based on typical stale-listing flexibility.
- Recommended offer: $271k (21.5% below list) — sets the bar for 1% rule.
- Local home prices are declining (-3.0%/yr); year-one equity from $2k of loan paydown is wiped out by about $10k of value loss. Plan a longer hold.
- Location reads: area grade D — affects rentability + tenant quality, not the cash-flow math above.
- Milford School District (urban): math 44% / reading 58% proficiency, ranked #73 of 153 in CT (top 48%) — acceptable for families but not a draw, mixed tenant base, ~2y average lease; only 15% free/reduced lunch — higher-income household profile.
- Zoned schools: Orchard Hills School (math 37% / reading 57%, grade D-, #256 of 553 statewide, top 48%, 347 students, 22% FRL); East Shore Middle School (math 43% / reading 56%, grade C, #79 of 175 statewide, top 45%, 382 students, 23% FRL); Joseph A. Foran High School (math 47% / reading 67%, grade C, #52 of 194 statewide, top 31%, 765 students, 26% FRL).
- Watch-outs: built in 1930 — expect roof / HVAC / electrical / plumbing capex.
- Market conditions: Rents rising (+2.2%/yr); 182 active listings in the ZIP; 12 comparable units currently listed for rent nearby; rentals leasing fast (median 13d on market — plan ~1-2 weeks tenant-placement turnaround); solid renter incomes; 1,059 units permitted in South Central Connecticut Planning Region in 2024 (779 in 5+ unit buildings).
- Climate carrying-cost: major wind risk, 68% chance of damaging wind over 30y; extreme-heat days projected 7→16/yr by 2055 (HVAC capex compounding) — expect insurance premiums to compound above CPI over the hold.
- Cap rate 5.5% vs local median 3.6% in Milford city (balance) — top-decile yield for the area; either an underpriced asset or a hidden risk that comps aren't pricing in. Stress-test before assuming the spread holds.
- This rent runs 31% of the median local income ($104k/yr) — at the standard rent-burdened threshold; future hikes will face affordability resistance.
Questions for listing agent
- What do current leases actually rent for vs. the listed asking? Can we see a recent rent roll and the last 12 months of T-12 income?
- It's been on market 49 days. Have you received any prior offers? Is the seller open to a 22% concession, seller financing, or rate buy-down credit?
- Built in 1930 — when were the roof, HVAC, electrical panel, plumbing, and water heater last replaced?
- Is there a deadline driving the sale (1031 exchange, divorce, estate, relocation)? That informs how much negotiation room exists.
- The area grade is low — what's the realistic commute time and amenity access for the typical tenant pool here? Any planned neighborhood developments (good or bad) we should know about?
- What's the average days-on-market for RENTAL listings here right now (not sales)? A rising rental-DOM trend means longer vacancies and softer asking-rent achievability than the comps imply.
- What's the recent tenant-quality profile in this submarket — average credit score on applications, eviction rate, late-payment / NSF rate, and stable-employment percentage? A property-management company in the area should have these aggregated.
- How much new for-sale + rental construction is in the pipeline within 1–3 miles? Heavy new supply typically softens prices + rents 12–24 months out; constrained supply supports both.
CashFlowRE · CFR-95YBPRA2V19Y7P
· Data 1 week ago
cashflowre.app · 2026-05-29