39 Soundview Ave · Milford city (balance), CT
Flood risk 1/10 · Minimal
- FEMA flood zone
- X (unshaded)
- Chance of flooding over 30 yrs
- 0.0%
- Est. flood insurance / yr
- $473 – $860
Fire risk 1/10 · Minimal
- Est. fire insurance / yr
- $829 – $1,539
Heat risk 6/10 · Moderate
- Hot days now (above 96°F)
- 7 days/yr
- Hot days in 30 yrs
- 16 days/yr
Wind risk 6/10 · Moderate
- Chance of severe wind over 30 yrs
- 68.0%
Air-quality risk 4/10 · Minor
- Unhealthy air days now
- 5 days/yr
- Unhealthy air days in 30 yrs
- 7 days/yr
Risk factors via First Street. Map © Google.
Why this score? — see what drove the D grade
The composite is a weighted blend of 9 inputs, each scored 0–100. Each bar is that input's sub-score; the figure is the points it added to the 100-point composite (weight × sub-score).
- ARV discount +15.0/15.0
- Cash flow +9.5/30.0
- Schools +4.6/10.0
- Rent growth +3.0/5.0
- 1% rule +2.8/10.0
- DSCR +2.7/10.0
- Livability +2.5/5.0
- Condition / age +2.5/5.0
- Appreciation +0.0/10.0
$345,000
🖨 Deal sheet (PDF) 📄 Offer letter ✓ Due diligence
Listing remarks
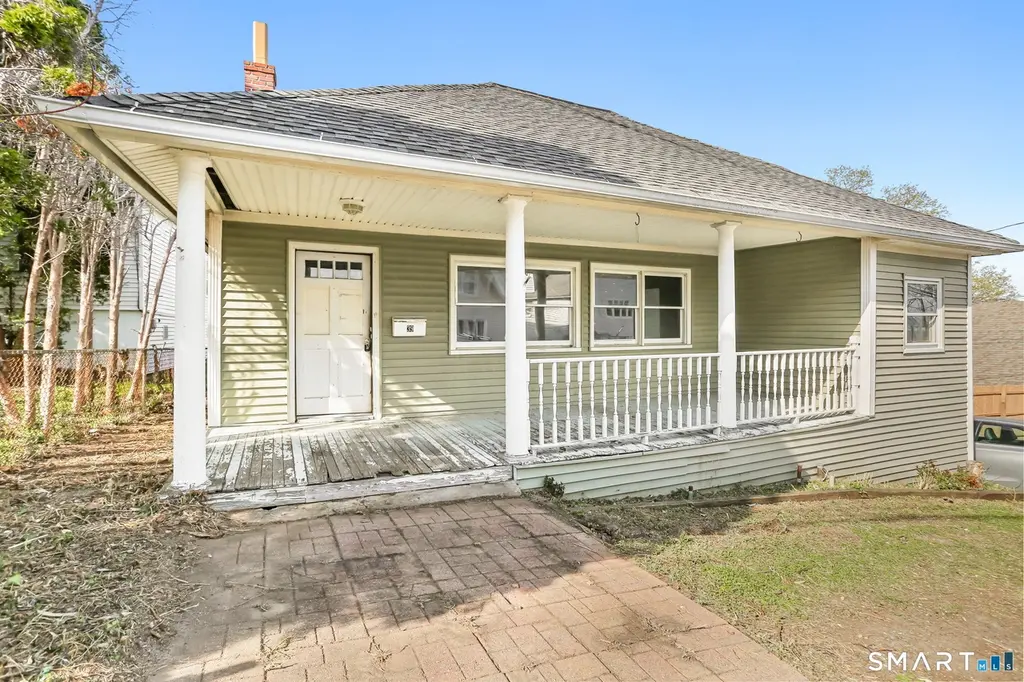
Welcome to 39 Soundview Avenue in coastal Milford-an incredible opportunity to break into one of the area's most desirable beachside neighborhoods. Ideally situated just off the Long Island Sound, this home offers the lifestyle so many seek, with a short walk to the shoreline and nearby Burwells Beach for sun, sand, and sea breezes. Located within the sought-after Orchard Hills Elementary School district, the setting alone makes this property a standout. The home itself is a true fixer-upper and will require TLC, but presents a fantastic entry point for people looking to invest, renovate, and build equity in a prime location. Whether you're envisioning a year-round residence, seasonal getaw
Key facts
- 3,484 sq ft lot
- Built 1930
- Listed 49 days
Tags
Property features AI
Finance
- Financial info: Assessed value listed
Exterior
- Utilities: Public water connected; Public sewer connected
- Home design: Single-family home
- Construction: Block construction; Block foundation; Asphalt shingle roof; Vinyl siding; Built area approximately 1,157 (per public record)
- Exterior features: Porch; Deck; Located on a cul-de-sac; Walk to water with beach rights
Interior
- Kitchen: Electric range; Refrigerator; Dishwasher
- Bedrooms: 3 bedrooms
- Bathrooms: 1 full bathroom
- Heating & cooling: Hot water heating (natural gas); Central air conditioning
- Interior features: Full unfinished basement; Has attic with access via hatch; One fireplace
- Laundry & utility: Domestic hot water
Neighborhood map
What this means for you Summary
Snapshot
- This is a 3-bed/1.0-bath single-family listed at $345k.
Deal economics
- At list price, monthly cash flow is $-241 ($-3k/yr) — negative.
- To cash-flow at today's rent, offer at most $302k (12.3% below list).
- To meet the 1% rule (rent ≥ 1% of price), the offer needs to be $271k (21.5% below list).
- Recommended offer: $271k (21.5% below list) — sets the bar for 1% rule.
- Cap rate 5.5% vs local median 3.6% in Milford city (balance) — top-decile yield for the area; either an underpriced asset or a hidden risk that comps aren't pricing in. Stress-test before assuming the spread holds.
Location & tenants
- Location reads: area grade D — affects rentability + tenant quality, not the cash-flow math above.
- Milford School District (urban): math 44% / reading 58% proficiency, ranked #73 of 153 in CT (top 48%) — acceptable for families but not a draw, mixed tenant base, ~2y average lease; only 15% free/reduced lunch — higher-income household profile.
- Zoned schools: Orchard Hills School (math 37% / reading 57%, grade D-, #256 of 553 statewide, top 48%, 347 students, 22% FRL); East Shore Middle School (math 43% / reading 56%, grade C, #79 of 175 statewide, top 45%, 382 students, 23% FRL); Joseph A. Foran High School (math 47% / reading 67%, grade C, #52 of 194 statewide, top 31%, 765 students, 26% FRL).
- Market conditions: Rents rising (+2.2%/yr); 182 active listings in the ZIP; 12 comparable units currently listed for rent nearby; rentals leasing fast (median 13d on market — plan ~1-2 weeks tenant-placement turnaround); solid renter incomes; 1,059 units permitted in South Central Connecticut Planning Region in 2024 (779 in 5+ unit buildings).
- This rent runs 31% of the median local income ($104k/yr) — at the standard rent-burdened threshold; future hikes will face affordability resistance.
Forward outlook
- Local home prices are declining (-3.0%/yr); year-one equity from $2k of loan paydown is wiped out by about $10k of value loss. Plan a longer hold.
Negotiation context
- It's been on market 49 days — a 3% lower offer ($335k) is reasonable based on typical stale-listing flexibility.
Risks & watch-outs
- Watch-outs: built in 1930 — expect roof / HVAC / electrical / plumbing capex.
- Climate carrying-cost: major wind risk, 68% chance of damaging wind over 30y; extreme-heat days projected 7→16/yr by 2055 (HVAC capex compounding) — expect insurance premiums to compound above CPI over the hold.
Questions for the listing agent
- What do current leases actually rent for vs. the listed asking? Can we see a recent rent roll and the last 12 months of T-12 income?
- It's been on market 49 days. Have you received any prior offers? Is the seller open to a 22% concession, seller financing, or rate buy-down credit?
- Built in 1930 — when were the roof, HVAC, electrical panel, plumbing, and water heater last replaced?
- Is there a deadline driving the sale (1031 exchange, divorce, estate, relocation)? That informs how much negotiation room exists.
- The area grade is low — what's the realistic commute time and amenity access for the typical tenant pool here? Any planned neighborhood developments (good or bad) we should know about?
- What's the average days-on-market for RENTAL listings here right now (not sales)? A rising rental-DOM trend means longer vacancies and softer asking-rent achievability than the comps imply.
- What's the recent tenant-quality profile in this submarket — average credit score on applications, eviction rate, late-payment / NSF rate, and stable-employment percentage? A property-management company in the area should have these aggregated.
- How much new for-sale + rental construction is in the pipeline within 1–3 miles? Heavy new supply typically softens prices + rents 12–24 months out; constrained supply supports both.
Investment metrics
- 1% rule
- 0.78% ✗
- Cap rate
- 5.46%
- Cash-on-cash
- -2.99%
- DSCR
- 0.87
- GRM
- 10.6
CMA / ARV
- ARV (median comp)
- $510,499
- List price
- $345,000
- Delta
- -32.42%
- Verdict
- UNDERPRICED
- Comps
- 20 within 1.0 mi
Show comp detail 12 sales within ~0.75 mi
| Address | Dist | Beds/Ba | Sqft | Sold | Price | $/sf | Match |
|---|---|---|---|---|---|---|---|
| 62 Pearson Ave | 0.27mi | 3/1.0 | 1,056 (-9%) | 2mo | $300,000 | $284 | 71 |
| 38 Soundview Ave | 0.02mi | 2/2.0 (-1) | 1,276 (+10%) | 10mo | $475,000 | $372 | 65 |
| 32 Burwell Ave | 0.15mi | 2/1.0 (-1) | 1,293 (+12%) | 6mo | $468,000 | $362 | 63 |
| 15 Brewster Rd | 0.67mi | 3/2.0 | 1,172 (+1%) | 2mo | $475,000 | $405 | 61 |
| 10 Sperry St | 0.18mi | 2/2.0 (-1) | 1,022 (-12%) | 6mo | $416,000 | $407 | 58 |
| 4 Alpha St | 0.68mi | 3/1.0 | 1,175 (+2%) | 9mo | $450,000 | $383 | 58 |
| 55 Mary Ellen Dr | 0.45mi | 3/1.0 | 1,032 (-11%) | 10mo | $435,000 | $422 | 52 |
| 168 Kings Hwy | 0.63mi | 3/1.5 | 1,068 (-8%) | 10mo | $630,000 | $590 | 48 |
| 207 Merwin Ave | 0.59mi | 2/1.0 (-1) | 1,033 (-11%) | 7mo | $335,000 | $324 | 44 |
| 470 Pond Point Ave | 0.71mi | 2/1.0 (-1) | 1,260 (+9%) | 6mo | $400,000 | $317 | 42 |
| 83 Yale Ave | 0.49mi | 3/2.5 | 1,324 (+14%) | 7mo | $615,000 | $465 | 41 |
| 15 Alpha St | 0.71mi | 3/2.0 | 1,328 (+15%) | 6mo | $450,000 | $339 | 34 |
Match score weights: distance 35% · size 25% · config 20% · recency 20%. Top-matched comps best support the ARV.
Projected returns pro-forma
-3.0% appreciation · 2.19% rent growth · sell at horizon
- IRR
- -22.2%
- Equity multiple
- 0.24×
- Total profit
- $-73,383
- Equity at exit
- $51,441
- IRR
- -18.3%
- Equity multiple
- 0.04×
- Total profit
- $-92,319
- Equity at exit
- $29,829
Cash invested: $96,600 (down + closing). Projections, not guarantees.
Landlord ↔ Tenant lean methodology
- Overall (STATE)
- 27 Tenant-Leaning
- State Connecticut
- 27 Tenant-Leaning · D+7
- County
- — inherits STATE
- City
- — inherits STATE
ZIP-level market 06460
- Rents YoY
- 2.2%
- Active inventory
- 182
- Price-to-rent
- 10.6×
Monthly cashflow live
- Estimated rent
- $2,707 high interval (Pro) →
- Mortgage (P&I)
- −$1,809
- Tax from tax record
- −$426 /mo · $5,111/yr
- Insurance
- −$144
- HOA
- −$0
- Vacancy / Maint / Mgmt
- −$568
- Net cashflow
- $-241
Break-even live
Sensitivity live
| Price | -10% $-45 | -5% $-143 | +0% $-241 | +5% $-338 | +10% $-436 |
|---|---|---|---|---|---|
| Rent | -10% $-454 | -5% $-348 | +0% $-241 | +5% $-134 | +10% $-27 |
| Rate | -1.0pp $-67 | -0.5pp $-153 | base $-241 | +0.5pp $-330 | +1.0pp $-421 |
UW: 25.0% down · 7.5% · 30yr · 1.5% tax · 5.0% vac · 8.0% maint · 8.0% mgmt
Financing live
Cash to close
- Down payment
- $86,250
- Closing costs
- $10,350
- Reserves months
- —
- Total cash needed
- —
Loan-product check · same deal, 3 products live
Conventional
25% down · 7.5% · 30yr
- Down + closing
- —
- Monthly P&I
- —
- Monthly cashflow
- —
- DSCR
- —
- Eligible?
- —
Personal DTI + credit; lowest rate.
DSCR
20% down · 8.5% · 30yr
- Down + closing
- —
- Monthly P&I
- —
- Monthly cashflow
- —
- DSCR
- —
- Eligible?
- —
No personal income docs; deal must DSCR.
Hard money
10% down · 12.0% · 12mo
- Down + closing
- —
- Monthly P&I
- —
- Monthly cashflow
- —
- DSCR
- —
- Eligible?
- —
Short-term bridge; refi at stabilization.
Rent comps 12 comps
| Address | Beds | Baths | Sqft | Rent | $/sqft | DOM | Units | Dist |
|---|---|---|---|---|---|---|---|---|
| 42 Whalley Ave Milford, CT | 3.0 | 1.0 | 958 | $2,500 | $2.61 | 4d | 1 | 0.19mi |
| 42 Whalley Ave Milford, CT | 3.0 | 1.0 | 958 | $2,500 | $2.61 | 23d | 1 | 0.19mi |
| 1080 New Haven Ave #91 Milford, CT | 2.0 | 1.5 | 963 | $2,300 | $2.39 | 4d | 1 | 0.62mi |
| 140 Beach Ave Unit 2 Milford, CT | 2.0 | 1.0 | 1096 | $2,600 | $2.37 | 45d | 1 | 0.68mi |
| 158 Chapel St Unit 2 Milford, CT | 3.0 | 1.0 | 1213 | $1,945 | $1.60 | 45d | 1 | 0.68mi |
| 23 Village Rd Milford, CT | 2.0 | 1.5 | 1058 | $3,100 | $2.93 | 5d | 1 | 0.74mi |
| 153 Penn Cmn #153 Milford, CT | 2.0 | 1.5 | 1092 | $2,500 | $2.29 | 13d | 1 | 0.96mi |
| 102 Salem Walk #102 Milford, CT | 3.0 | 1.5 | 1320 | $3,400 | $2.58 | 4d | 1 | 0.98mi |
| 59 Melba St Milford, CT | 3.0 | 1.5 | 1186 | $3,500 | $2.95 | 13d | 1 | 1.32mi |
| 27 Melba St Unit B Milford, CT | 3.0 | 1.0 | 1008 | $2,799 | $2.78 | 45d | 1 | 1.38mi |
| 18 Melba St Milford, CT | 2.0 | 1.0 | 702 | $2,200 | $3.13 | 4d | 1 | 1.39mi |
| 17 W Orland St Milford, CT | 3.0 | 1.0 | 1004 | $3,999 | $3.98 | 45d | 1 | 1.44mi |
Listing history 11 events
-
2026-06-13status $345,000 Under Contract 49 DOM
-
2026-06-10days on market $345,000 Active 49 DOM
-
2026-06-09days on market $345,000 Active 48 DOM
-
2026-06-08days on market $345,000 Active 47 DOM
-
2026-06-07days on market $345,000 Active 46 DOM
-
2026-06-03days on market $345,000 Active 42 DOM
-
2026-06-03days on market $345,000 Active 41 DOM
-
2026-06-01days on market $345,000 Active 40 DOM
-
2026-05-31days on market $345,000 Active 39 DOM
-
2026-05-14price $345,000 881-char remark
-
2026-04-22$380,000 Active 881-char remark
ⓘ Source: listings_history table (triggers on properties + properties_extension) + one-shot
backfill from property_details.listing_events for pre-trigger history.
Tax reassessment forecast CT · Partial reset (capped growth)
- Current annual tax
- $5,111 · $426/mo
- Projected year-2 tax
- $6,247 · $521/mo
- Expected delta
- +$1,136/yr (+$95/mo · 22.2%)
ⓘ Screening estimate from a state-policy table — verify with the county assessor before closing.
Climate risk First Street
- Flood 1/10 Low FEMA zone X (unshaded) · 0% chance over 30 yrs
- Wildfire 1/10 Low
- Heat 6/10 Major 7 d/yr ≥96°F today · 16 d/yr by 30 yrs out
- Wind 6/10 Major 68% chance of damaging wind over 30 yrs
- Air quality 4/10 Moderate 5 unhealthy d/yr today · 7 by 30 yrs out
Nearby sold comps map
Loading sold comps map…
Walkable amenities ~0.75 mi
Loading nearby amenities…
Taxation est. · year 1
- Rental income
- $32,479
- − Mortgage interest
- −$19,325
- − Property taxes
- −$5,111
- − Insurance
- −$1,725
- − Repairs & maintenance
- −$2,598
- − Management
- −$2,598
- − Depreciation
- −$10,036
- Taxable loss
- −$8,915
- Est. tax savings @ 24.0%
- +$2,140
- After-tax cash flow
- $-748/yr
For passive investors: Depreciation is non-cash, so a rental often shows a tax loss while cash-flowing — sheltering income. Rental losses are passive: they offset passive income freely, and up to $25,000/yr can offset ordinary (W-2) income if you actively participate and your MAGI is under $100k (phasing out to $0 by $150k); unused losses carry forward. On sale, claimed depreciation is recaptured at up to 25%, and gains may owe capital-gains tax (a 1031 exchange can defer both). Figures are a year-1 estimate at your 24.0% rate — not tax advice; consult a CPA.
Schools (NCES district)
- District
- Milford School District
- NCES district ID
- 0902520
- Math proficiency
- 44% ▼ -14.00%
- Reading proficiency
- 58% ▼ -11.00%
- Median HH income
- $80,198
- Composite
- 46.45/100
- National rank
- #2444
- State rank
- #73 of 153 in CT
Livability — Milford city (balance)
No livability data for this city. (Only ~50 U.S. cities are tracked.)
Census & demographics
- Census place
- Milford city (balance), CT
- County
- New Haven County · 688,236 people
- City population
- 52,340
- Metro
- New Haven-Milford, CT
- Population (ZIP)
- 37,649
- Household income
- $104,360
- Rent vs Own
- Severe rent burden
- 1254.0
Population outlook (South Central Connecticut County) Hauer SSP2
- By 2040
- 608,362
Race, ethnicity, and origin ACS 2023
- Neighborhood character
- Predominantly White (82%)
- Race & ethnicity
- White 82% Hispanic / Latino 8% Two or more races 7% Asian 3% Black 3%
- Hispanic origin (detail)
- Puerto Rican 4%
- Common ancestry
- Romanian 6% Lithuanian 4% Scotch-Irish 2%
- Foreign-born
- 10% · Canada, China, Jamaica
- Languages at home
- 88% English-only · Spanish 4% Other Indo-European 3% Other Asian/Pacific 1%
Political lean MEDSL · South Central Connecticut
- 2024 margin
- Strong D (+20.1) · D 59.0% · R 38.9% · Other 2.1%
- All cycles
- 2024: D+20.1
Not yet ingested
- Civics
- —
Market trends
- HPI YoY
- ▼ -396.40%
- Current HPI
- 287.7738
- Rent YoY
- ▲ 2.19%
- Metro
- New Haven-Milford, CT
- State GDP YoY
- ▲ 1.06%
- F500 in state
- 38
Industry mix (Fortune 500 HQ in CT)
| Industry | F500 HQs | Revenue |
|---|---|---|
| Industrial Machinery | 4 | $38B |
|
||
| Insurance | 3 | $71B |
|
||
| Financial Services | 2 | $25B |
|
||
| Transportation / Logistics | 2 | $18B |
|
||
| Healthcare | 1 | $247B |
|
||
| Telecommunications | 1 | $55B |
|
||
Price history
-9.2% since first listed3 events — show timeline
- 2026-06-11 Pending — Smart MLS
- 2026-05-14 Price Changed $345,000 Smart MLS
- 2026-04-22 Listed $380,000 Smart MLS
Property tax history
+1.2%/yrLatest (2023): $5,111 · +2.0% YoY. Source: county tax records.
Cash-flow waterfall
monthlySold comps — $/sqft
last 12 mo · ≤1 miLoading sold comps…