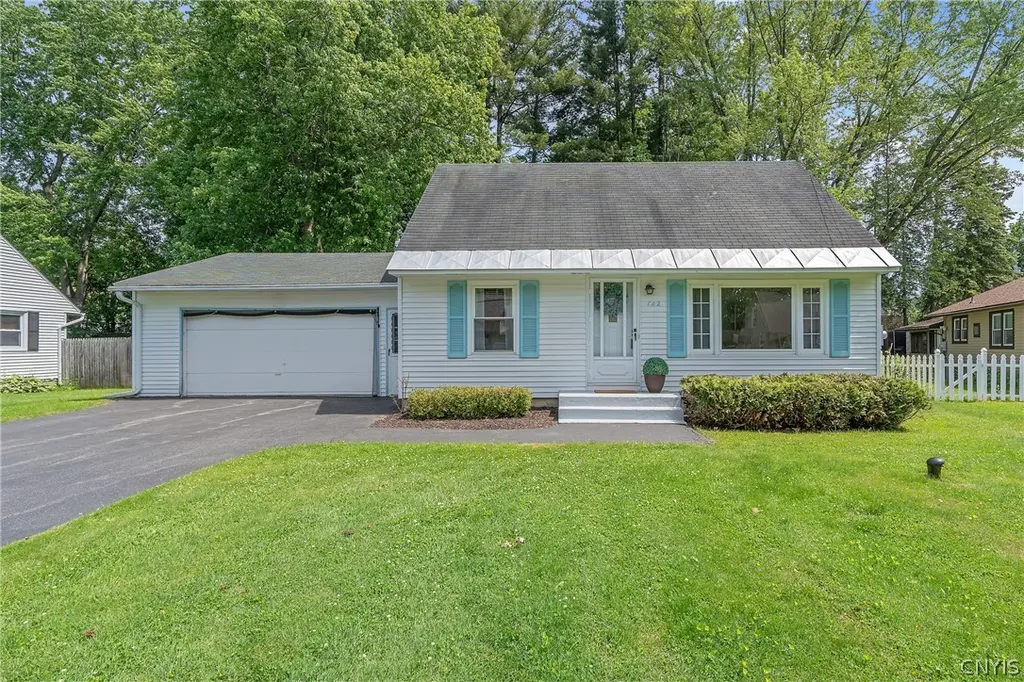
102 Juanita Dr
Liverpool, NY 13090
$229,000D
3 bd · 1.0 ba ·
1,080 sqft ·
Built 1955
· SingleFamily
· Pending
· 6 DOM
Cashflow @ list (25.0% down · 7.5%)
Estimated rent
$2,293/mo
Mortgage (P&I)
−$1,201
Tax + insurance
−$604
HOA
−$0
Vac / Maint / Mgmt
−$481
Net cashflow
$6/mo
Annual
$72/yr
Cap rate
6.32%
Cash-on-cash
0.11%
DSCR
1.00
1% rule
1.00%
Cash to close
$64,120
Investor read
- This is a 3-bed/1.0-bath single-family listed at $229k.
- At list price, monthly cash flow is $6 ($72/yr) — positive.
- The deal already cash-flows at list — no discount required.
- Meets the 1% rule at list price ($2k rent vs $229k).
- Only 6 days on market — expect competitive offers; lowballing is unlikely to land.
- Local home prices are declining (-3.0%/yr); year-one equity from $2k of loan paydown is wiped out by about $7k of value loss. Plan a longer hold.
- Location reads 86/100 on livability (#16 in NY, #363 nationally) — a professional / high-income tenant draw. Strengths: commute A+, housing A+, health & safety A+.
- Liverpool Central School District (suburban): math 49% / reading 49% proficiency, ranked #381 of 590 in NY (top 65%) — families likely to look elsewhere, expect single-tenant / working-renter base with shorter leases.
- Zoned schools: Long Branch Elementary School (math 42% / reading 47%, grade F, #1,277 of 2,108 statewide, top 64%, 354 students, 54% FRL); Liverpool Middle School (math 47% / reading 62%, grade B-, #214 of 729 statewide, top 31%, 313 students, 51% FRL); Liverpool High School (math 94% / reading 54%, grade B+, #658 of 1,100 statewide, top 60%, 2,124 students, 42% FRL) — zoned schools average 49% FRL vs 28% district-wide (21 pts higher); higher-poverty schools than district average — tighter screening recommended.
- Watch-outs: property tax is 2.7% of price; built in 1955 — expect roof / HVAC / electrical / plumbing capex.
- Market conditions: 96 active listings in the ZIP; 3 comparable units currently listed for rent nearby; rentals lingering (median 46d on market — plan ~5-8 weeks vacancy on turnover, expect pricing pressure); 67% of comp listings sitting > 30 days — soft ceiling on asking rent; solid renter incomes; 616 units permitted in Onondaga County in 2024 (256 in 5+ unit buildings).
- Onondaga County population projected to shrink 9% by 2050 — rents likely to lag national; underwrite the cash flow, not the appreciation.
- Cap rate 6.3% vs local median 5.0% in Liverpool — meaningfully above typical; check what's discounted (condition, days-on-market, listing class) to confirm the premium yield is real.
- This rent runs 31% of the median local income ($88k/yr) — at the standard rent-burdened threshold; future hikes will face affordability resistance.
Questions for listing agent
- Built in 1955 — when were the roof, HVAC, electrical panel, plumbing, and water heater last replaced?
- Property tax is high relative to price — has the assessment been appealed recently, and will the sale trigger a re-assessment?
- Is there a deadline driving the sale (1031 exchange, divorce, estate, relocation)? That informs how much negotiation room exists.
- The area grade is low — what's the realistic commute time and amenity access for the typical tenant pool here? Any planned neighborhood developments (good or bad) we should know about?
- What's the average days-on-market for RENTAL listings here right now (not sales)? A rising rental-DOM trend means longer vacancies and softer asking-rent achievability than the comps imply.
- What's the recent tenant-quality profile in this submarket — average credit score on applications, eviction rate, late-payment / NSF rate, and stable-employment percentage? A property-management company in the area should have these aggregated.
- How much new for-sale + rental construction is in the pipeline within 1–3 miles? Heavy new supply typically softens prices + rents 12–24 months out; constrained supply supports both.
CashFlowRE · CFR-96XW2P449PB9EM
· Data 1 week ago
cashflowre.app · 2026-05-29