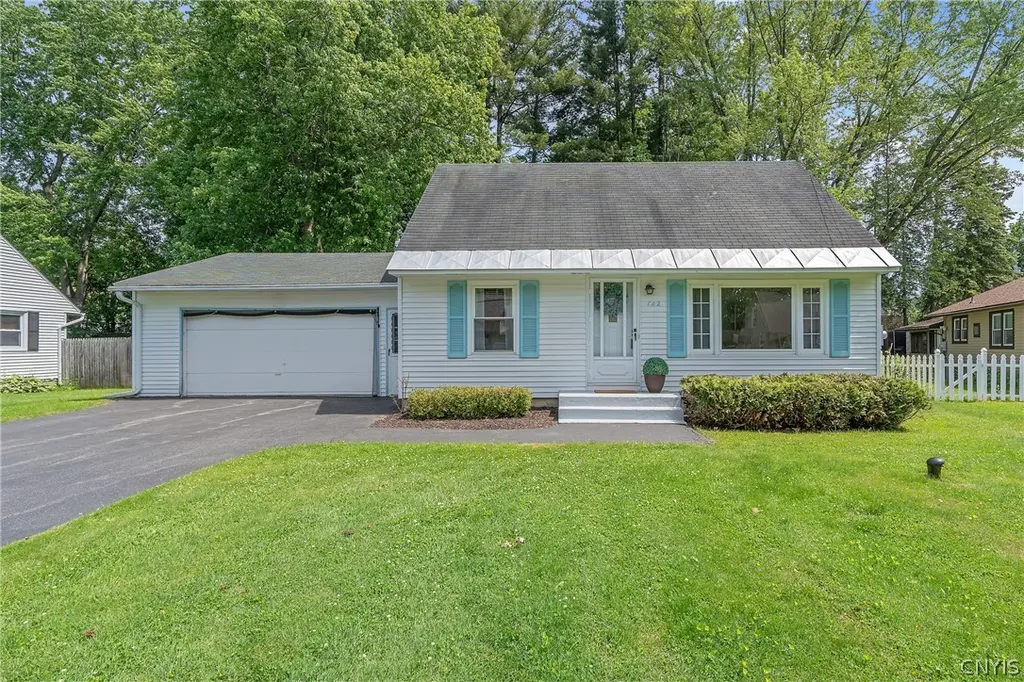
102 Juanita Dr · Liverpool, NY
Flood risk No data
- FEMA flood zone
- —
- Chance of flooding over 30 yrs
- —
- Est. flood insurance / yr
- —
Fire risk No data
- Est. fire insurance / yr
- —
Heat risk No data
- Hot days now (above threshold)
- —
- Hot days in 30 yrs
- —
Wind risk No data
- Chance of severe wind over 30 yrs
- —
Air-quality risk No data
- Unhealthy air days now
- —
- Unhealthy air days in 30 yrs
- —
Risk factors via First Street. Map © Google.
Why this score? — see what drove the D grade
The composite is a weighted blend of 9 inputs, each scored 0–100. Each bar is that input's sub-score; the figure is the points it added to the 100-point composite (weight × sub-score).
- Cash flow +13.4/30.0
- ARV discount +6.6/15.0
- 1% rule +5.0/10.0
- Schools +4.3/10.0
- Livability +4.3/5.0
- DSCR +4.0/10.0
- Rent growth +2.5/5.0
- Condition / age +2.5/5.0
- Appreciation +0.0/10.0
$229,000
🖨 Deal sheet (PDF) 📄 Offer letter ✓ Due diligence
Listing remarks
Well-maintained Cape Cod in the Liverpool School District! Lovingly cared for by the same family for over 65 years, this charming 3 bedroom, 2 bath home is nestled on a quiet neighborhood street and offers wonderful curb appeal along with a beautiful tree-lined backyard! A freshly painted front porch welcomes you inside, where you'll find gleaming hardwood floors, nice neutral paint, and abundant natural light from the large picture window in living room. The spacious kitchen and first-floor bath provide plenty of room to add your own style and updates over time. The formal dining room features brand-new carpeting and creates an inviting space for gatherings. A convenient first-floor bedroo
Key facts
- Large picture window
- Spacious kitchen
- Tree-lined backyard
Tags
Property features AI
Exterior
- Parking: Attached garage with two spaces; Driveway; Garage door opener
- Utilities: Public water connected; Sewer connected; Cable available; High-speed internet available; Gas water heater
- Home design: Single-story home; Resale property; Exterior facing information not provided
- Construction: Aluminum and vinyl siding; Asphalt shingle roof; Block foundation; Existing year built (original construction)
- Exterior features: Blacktop driveway; Enclosed porch; Open porch; Private yard; Shed(s) and storage; See remarks; Near public transit; Rectangular residential lot; City street frontage; Lot dimensions approximately 79 x 133
Interior
- Kitchen: Gas oven and gas range; Microwave; Refrigerator
- Bedrooms: One bedroom on the main level
- Flooring: Carpet; Tile; Varies
- Bathrooms: Two full bathrooms; One full bathroom on the main level
- Heating & cooling: Gas forced air heating; Window cooling units
- Interior features: Separate/formal dining room; Entrance foyer; Separate/formal living room; Natural woodwork; Workshop; Storm windows; Thermal windows
- Laundry & utility: Washer and dryer; Laundry in basement
Neighborhood map
What this means for you Summary
Snapshot
- This is a 3-bed/1.0-bath single-family listed at $229k.
Deal economics
- At list price, monthly cash flow is $6 ($72/yr) — positive.
- The deal already cash-flows at list — no discount required.
- Meets the 1% rule at list price ($2k rent vs $229k).
- Cap rate 6.3% vs local median 5.0% in Liverpool — meaningfully above typical; check what's discounted (condition, days-on-market, listing class) to confirm the premium yield is real.
Location & tenants
- Location reads 86/100 on livability (#16 in NY, #363 nationally) — a professional / high-income tenant draw. Strengths: commute A+, housing A+, health & safety A+.
- Liverpool Central School District (suburban): math 49% / reading 49% proficiency, ranked #381 of 590 in NY (top 65%) — families likely to look elsewhere, expect single-tenant / working-renter base with shorter leases.
- Zoned schools: Long Branch Elementary School (math 42% / reading 47%, grade F, #1,277 of 2,108 statewide, top 64%, 354 students, 54% FRL); Liverpool Middle School (math 47% / reading 62%, grade B-, #214 of 729 statewide, top 31%, 313 students, 51% FRL); Liverpool High School (math 94% / reading 54%, grade B+, #658 of 1,100 statewide, top 60%, 2,124 students, 42% FRL) — zoned schools average 49% FRL vs 28% district-wide (21 pts higher); higher-poverty schools than district average — tighter screening recommended.
- Market conditions: 94 active listings in the ZIP; 3 comparable units currently listed for rent nearby; rentals lingering (median 46d on market — plan ~5-8 weeks vacancy on turnover, expect pricing pressure); 67% of comp listings sitting > 30 days — soft ceiling on asking rent; solid renter incomes; 616 units permitted in Onondaga County in 2024 (256 in 5+ unit buildings).
- This rent runs 31% of the median local income ($88k/yr) — at the standard rent-burdened threshold; future hikes will face affordability resistance.
Forward outlook
- Local home prices are declining (-3.0%/yr); year-one equity from $2k of loan paydown is wiped out by about $7k of value loss. Plan a longer hold.
- Onondaga County population projected to shrink 9% by 2050 — rents likely to lag national; underwrite the cash flow, not the appreciation.
Negotiation context
- Only 6 days on market — expect competitive offers; lowballing is unlikely to land.
Risks & watch-outs
- Watch-outs: property tax is 2.7% of price; built in 1955 — expect roof / HVAC / electrical / plumbing capex.
Questions for the listing agent
- Built in 1955 — when were the roof, HVAC, electrical panel, plumbing, and water heater last replaced?
- Property tax is high relative to price — has the assessment been appealed recently, and will the sale trigger a re-assessment?
- Is there a deadline driving the sale (1031 exchange, divorce, estate, relocation)? That informs how much negotiation room exists.
- The area grade is low — what's the realistic commute time and amenity access for the typical tenant pool here? Any planned neighborhood developments (good or bad) we should know about?
- What's the average days-on-market for RENTAL listings here right now (not sales)? A rising rental-DOM trend means longer vacancies and softer asking-rent achievability than the comps imply.
- What's the recent tenant-quality profile in this submarket — average credit score on applications, eviction rate, late-payment / NSF rate, and stable-employment percentage? A property-management company in the area should have these aggregated.
- How much new for-sale + rental construction is in the pipeline within 1–3 miles? Heavy new supply typically softens prices + rents 12–24 months out; constrained supply supports both.
Investment metrics
- 1% rule
- 1.00% ✓
- Cap rate
- 6.32%
- Cash-on-cash
- 0.11%
- DSCR
- 1.00
- GRM
- 8.3
CMA / ARV
- ARV (on-the-fly)
- $224,640
- Comps found
- 9
Show comp detail 9 sales within ~0.75 mi
| Address | Dist | Beds/Ba | Sqft | Sold | Price | $/sf | Match |
|---|---|---|---|---|---|---|---|
| 107 Juanita Dr | 0.04mi | 3/1.0 | 1,080 (0%) | 3mo | $225,000 | $208 | 95 |
| 107 Kies Dr | 0.05mi | 3/1.5 | 1,080 (0%) | 20mo | $135,000 | $125 | 79 |
| 117 Knowland Dr | 0.09mi | 3/1.0 | 1,188 (+10%) | 0mo | $242,000 | $204 | 79 |
| 132 Duerr Rd | 0.64mi | 3/1.0 | 1,130 (+5%) | 3mo | $250,000 | $221 | 60 |
| 103 Knowland Dr | 0.19mi | 2/1.5 (-1) | 975 (-10%) | 13mo | $180,000 | $185 | 57 |
| 1305 Cold Springs Rd | 0.44mi | 2/2.0 (-1) | 1,104 (+2%) | 12mo | $231,000 | $209 | 57 |
| 341 Cameco Cir | 0.48mi | 2/1.5 (-1) | 1,072 (-1%) | 17mo | $180,000 | $168 | 55 |
| 121 Green Acres Dr | 0.36mi | 3/1.0 | 1,152 (+7%) | 24mo | $252,000 | $219 | 52 |
| 4055 Elmcrest Rd | 0.70mi | 3/1.5 | 1,198 (+11%) | 22mo | $253,940 | $212 | 29 |
Match score weights: distance 35% · size 25% · config 20% · recency 20%. Top-matched comps best support the ARV.
Projected returns pro-forma
-3.0% appreciation · 3.0% rent growth · sell at horizon
- IRR
- -16.0%
- Equity multiple
- 0.43×
- Total profit
- $-36,556
- Equity at exit
- $34,145
- IRR
- -7.5%
- Equity multiple
- 0.52×
- Total profit
- $-30,646
- Equity at exit
- $19,800
Cash invested: $64,120 (down + closing). Projections, not guarantees.
Landlord ↔ Tenant lean methodology
- Overall (STATE)
- 15 Strongly Tenant-Friendly
- State New York
- 15 Strongly Tenant-Friendly · D+10
- County
- — inherits STATE
- City
- — inherits STATE
ZIP-level market 13090
- Active inventory
- 94
- Price-to-rent
- 8.3×
Monthly cashflow live
- Estimated rent
- $2,293 medium interval (Pro) →
- Mortgage (P&I)
- −$1,201
- Tax from tax record
- −$509 /mo · $6,107/yr
- Insurance
- −$95
- HOA
- −$0
- Lot rent
- −$0
- Vacancy / Maint / Mgmt
- −$481
- Net cashflow
- $6
Break-even live
Sensitivity live
| Price | -10% $136 | -5% $71 | +0% $6 | +5% $-59 | +10% $-124 |
|---|---|---|---|---|---|
| Rent | -10% $-175 | -5% $-85 | +0% $6 | +5% $97 | +10% $187 |
| Rate | -1.0pp $121 | -0.5pp $64 | base $6 | +0.5pp $-53 | +1.0pp $-114 |
UW: 25.0% down · 7.5% · 30yr · 1.5% tax · 5.0% vac · 8.0% maint · 8.0% mgmt
Financing live
Cash to close
- Down payment
- $57,250
- Closing costs
- $6,870
- Reserves months
- —
- Total cash needed
- —
Loan-product check · same deal, 3 products live
Conventional
25% down · 7.5% · 30yr
- Down + closing
- —
- Monthly P&I
- —
- Monthly cashflow
- —
- DSCR
- —
- Eligible?
- —
Personal DTI + credit; lowest rate.
DSCR
20% down · 8.5% · 30yr
- Down + closing
- —
- Monthly P&I
- —
- Monthly cashflow
- —
- DSCR
- —
- Eligible?
- —
No personal income docs; deal must DSCR.
Hard money
10% down · 12.0% · 12mo
- Down + closing
- —
- Monthly P&I
- —
- Monthly cashflow
- —
- DSCR
- —
- Eligible?
- —
Short-term bridge; refi at stabilization.
Rent comps 3 comps
| Address | Beds | Baths | Sqft | Rent | $/sqft | DOM | Units | Dist |
|---|---|---|---|---|---|---|---|---|
| 364 Cameco Cir Liverpool, NY | 2.0 | 1.5 | 1072 | $2,200 | $2.05 | 15d | 1 | 0.48mi |
| 108 Parker Ave Liverpool, NY | 4.0 | 1.0 | 1152 | $1,875 | $1.63 | 46d | 1 | 1.08mi |
| 66 Grampian Rd Liverpool, NY | 1.0–2.0 | 1.0 | 840 | $1,300 | $1.55 | 46d | 1 | 1.36mi |
Listing history 6 events
-
2026-06-13statusdays on market $229,000 Pending 6 DOM
-
2026-06-10statusdays on market $229,000 Active Under Contract 4 DOM
-
2026-06-09days on market $229,000 Active 3 DOM
-
2026-06-08days on market $229,000 Active 2 DOM
-
2026-06-07remarks 699-char remark
-
2026-06-07$229,000 Active 1 DOM
ⓘ Source: listings_history table (triggers on properties + properties_extension) + one-shot
backfill from property_details.listing_events for pre-trigger history.
Tax reassessment forecast NY · Partial reset (capped growth)
- Current annual tax
- $6,107 · $509/mo
- Projected year-2 tax
- $6,107 · $509/mo
- Expected delta
- $0/yr ($0/mo · 0.0%)
ⓘ Screening estimate from a state-policy table — verify with the county assessor before closing.
Nearby sold comps map
Loading sold comps map…
Walkable amenities ~0.75 mi
Loading nearby amenities…
Taxation est. · year 1
- Rental income
- $27,512
- − Mortgage interest
- −$12,828
- − Property taxes
- −$6,107
- − Insurance
- −$1,145
- − Repairs & maintenance
- −$2,201
- − Management
- −$2,201
- − Depreciation
- −$6,662
- Taxable loss
- −$3,631
- Est. tax savings @ 24.0%
- +$872
- After-tax cash flow
- $943/yr
For passive investors: Depreciation is non-cash, so a rental often shows a tax loss while cash-flowing — sheltering income. Rental losses are passive: they offset passive income freely, and up to $25,000/yr can offset ordinary (W-2) income if you actively participate and your MAGI is under $100k (phasing out to $0 by $150k); unused losses carry forward. On sale, claimed depreciation is recaptured at up to 25%, and gains may owe capital-gains tax (a 1031 exchange can defer both). Figures are a year-1 estimate at your 24.0% rate — not tax advice; consult a CPA.
Schools (NCES district)
- District
- Liverpool Central School District
- NCES district ID
- 3617520
- Math proficiency
- 49% ▼ -6.00%
- Reading proficiency
- 49% ▲ 1.00%
- Median HH income
- $59,134
- Composite
- 42.84/100
- National rank
- #3134
- State rank
- #381 of 590 in NY
Livability — Liverpool
- Score
- 86/100
- State rank
- #16
- US rank
- #363
Category grades
Schools grade is shown separately in the Schools card above.
Census & demographics
- County
- Onondaga County · 247,257 people
- City population
- 29,004
- Metro
- Syracuse, NY
- Population (ZIP)
- 29,004
- Household income
- $88,492
- Rent vs Own
- Severe rent burden
- 733.0
Population outlook (Onondaga County) Hauer SSP2
- Today (2025)
- 467,894 people
- By 2030
- 463,381 · -1.0%
- By 2040
- 447,697 · -4.3%
- By 2050
- 426,399 · -8.9%
- By 2075
- 373,661 · -20.1%
- By 2100
- 307,967 · -34.2%
Race, ethnicity, and origin ACS 2023
- Neighborhood character
- Predominantly White (79%)
- Race & ethnicity
- White 79% Two or more races 9% Hispanic / Latino 7% Black 6% Asian 3%
- Hispanic origin (detail)
- Mexican 1% Puerto Rican 4%
- Common ancestry
- Romanian 7% Lithuanian 4% Italian 2%
- Foreign-born
- 6% · Canada, China, South Korea
- Languages at home
- 93% English-only · Other Indo-European 2% Spanish 1% Russian/Polish/Slavic 1%
Political lean MEDSL · Onondaga
- 2024 margin
- D (+17.3) · D 58.6% · R 41.4%
- 2008→2024 swing
- -3.0pp toward R · 2008: 20.3pp · 2024: 17.3pp
- All cycles
- 2024: D+17.3 2020: D+20.6 2016: D+12.8 2012: D+21.1 2008: D+20.3
Not yet ingested
- Civics
- —
Market trends
- HPI YoY
- ▼ -228.53%
- Current HPI
- 320.4989
- Rent YoY
- —
- Metro
- Syracuse, NY
- State GDP YoY
- ▲ 2.60%
- F500 in state
- 92
Industry mix (Fortune 500 HQ in NY)
| Industry | F500 HQs | Revenue |
|---|---|---|
| Financial Services | 10 | $950B |
|
||
| Consumer Goods | 9 | $162B |
|
||
| Insurance | 4 | $225B |
|
||
| Telecommunications | 2 | $144B |
|
||
| Pharmaceuticals | 2 | $112B |
|
||
| Media / Entertainment | 2 | $69B |
|
||
Price history
1 event — show timeline
- 2026-06-06 Listed $229,000 CNYIS
Property tax history
+7.1%/yrLatest (2025): $6,107 · +0.3% YoY. Source: county tax records.
Cash-flow waterfall
monthlySold comps — $/sqft
last 12 mo · ≤1 miLoading sold comps…