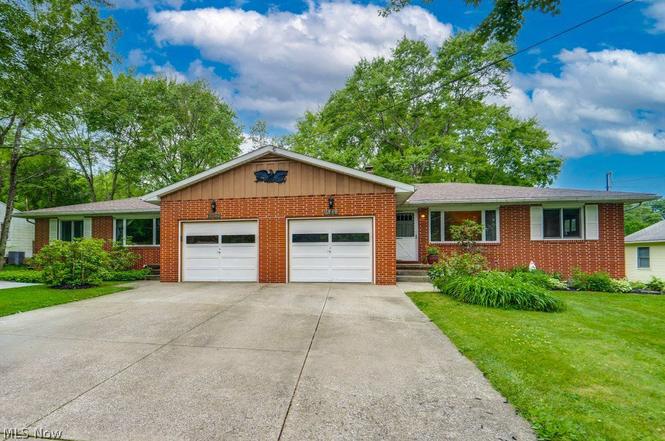
4748-4752 Sunnyside Dr
Stow, OH 44224
$299,900A-
4 bd · 3.0 ba ·
2,036 sqft ·
Built 1971
· MultiFamily
· Pending
· 3 DOM
Cashflow @ list (25.0% down · 7.5%)
Estimated rent
$5,388/mo
Mortgage (P&I)
−$1,573
Tax + insurance
−$477
HOA
−$0
Vac / Maint / Mgmt
−$1,131
Net cashflow
$2,206/mo
Annual
$26,476/yr
Cap rate
15.12%
Cash-on-cash
31.53%
DSCR
2.40
1% rule
1.80%
Cash to close
$83,972
Investor read
- This is a 3 × 4-bed/3.0-bath units multifamily listed at $300k.
- At list price, monthly cash flow is $2k ($26k/yr) — positive. Per door: $735/mo.
- The deal already cash-flows at list — no discount required.
- Meets the 1% rule at list price ($5k rent vs $300k).
- Only 3 days on market — expect competitive offers; lowballing is unlikely to land.
- Local home prices are declining (-3.0%/yr); year-one equity from $2k of loan paydown is wiped out by about $9k of value loss. Plan a longer hold.
- Location reads 76/100 on livability (#217 in OH, #3,390 nationally) — a middle-class / working-renter tenant base. Strengths: schools A+, cost of living A+, housing A+; Watch: amenities F, commute F.
- Stow-Munroe Falls City School District (suburban): math 58% / reading 64% proficiency, ranked #247 of 656 in OH (top 38%) — acceptable for families but not a draw, mixed tenant base, ~2y average lease; only 18% free/reduced lunch — higher-income household profile.
- Market conditions: Rents rising fast (+8.6%/yr); 113 active listings in the ZIP; solid renter incomes; 1,114 units permitted in Summit County in 2024 (397 in 5+ unit buildings).
- Summit County population projected to shrink 6% by 2050 — rents likely to lag national; underwrite the cash flow, not the appreciation.
- Current owner paid $184k; list at $300k implies a 63% gain — meaningful room to come down on a strong offer.
- At projected returns (-3.0% appreciation + 8.0% rent growth), your $84k cash investment doubles in ~4 years — after that, you're playing with house money.
- Cap rate 15.1% vs local median 3.5% in Stow — top-decile yield for the area; either an underpriced asset or a hidden risk that comps aren't pricing in. Stress-test before assuming the spread holds.
- At $5,388/mo this rent would consume 69% of the median local household income ($94k/yr) (locally 1165% of renters already pay >50% of income on rent) — very limited rent-growth headroom before tenants either downsize or default.
Questions for listing agent
- Can we see the unit-by-unit rent roll, current vacancy, and any below-market leases? What's the average tenancy length?
- What capital expenditures (roof, boiler, parking lot, exteriors) have been made in the last 5 years, and what's planned in the next 2?
- Built in 1971 — when were the roof, HVAC, electrical panel, plumbing, and water heater last replaced?
- Is there a deadline driving the sale (1031 exchange, divorce, estate, relocation)? That informs how much negotiation room exists.
- Schools are A-rated — typically a magnet for longer-tenancy family renters. What's the average tenant stay here, and is there a school-zone premium baked into asking?
- What's the average days-on-market for RENTAL listings here right now (not sales)? A rising rental-DOM trend means longer vacancies and softer asking-rent achievability than the comps imply.
- What's the recent tenant-quality profile in this submarket — average credit score on applications, eviction rate, late-payment / NSF rate, and stable-employment percentage? A property-management company in the area should have these aggregated.
- How much new apartment / multifamily construction is in the pipeline within 1–3 miles? Heavy new supply (>2% of stock underway) typically softens rents 12–24 months out; light construction supports rent growth.
CashFlowRE · CFR-9CJ79F2HHS0SDH
· Data 2 days ago
cashflowre.app · 2026-05-29