 Triplex
4748-4752 Sunnyside Dr · Stow, OH
Flood risk 1/10 · Minimal
- FEMA flood zone
- X (unshaded)
- Chance of flooding over 30 yrs
- 0.0%
- Est. flood insurance / yr
- $473 – $860
Fire risk 1/10 · Minimal
- Est. fire insurance / yr
- $713 – $1,323
Heat risk 3/10 · Minor
- Hot days now (above 96°F)
- 7 days/yr
- Hot days in 30 yrs
- 17 days/yr
Wind risk 1/10 · Minimal
- Chance of severe wind over 30 yrs
- —
Air-quality risk 3/10 · Minor
- Unhealthy air days now
- 2 days/yr
- Unhealthy air days in 30 yrs
- 4 days/yr
Risk factors via First Street. Map © Google.
Why this score? — see what drove the A- grade
The composite is a weighted blend of 9 inputs, each scored 0–100. Each bar is that input's sub-score; the figure is the points it added to the 100-point composite (weight × sub-score).
- Cash flow +30.0/30.0
- ARV discount +14.8/15.0
- 1% rule +10.0/10.0
- DSCR +10.0/10.0
- Schools +5.3/10.0
- Rent growth +4.6/5.0
- Livability +3.8/5.0
- Condition / age +2.5/5.0
- Appreciation +0.0/10.0
$299,900
🖨 Deal sheet (PDF) 📄 Offer letter ✓ Due diligence
Multi-family units
County records classify this as Multi-Family (2-4 Unit). Listing-text estimate: 3 units. confirmed
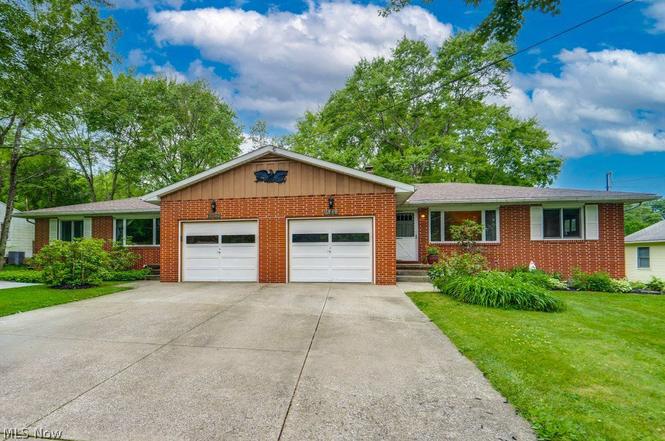
Listing remarks
Whether you’re looking to build your rental portfolio or live on one side while the rent covers your mortgage, this twinplex opportunity is one to jump on! Conveniently located between 91 and Rt. 8, you can get anywhere quickly, whether it’s work, groceries, carry-out, or lovely Meadowbrook Lake Park, which is just yards away! An inviting brick and cedar exterior offers mirror-image entry to either side unit! Both units have been very well maintained, one being owner-occupied and the other lived in by the same tenant for 17 years! The layouts are identical and include a family room with a big picture window, eat-in kitchens with sliders to a covered rear porch, 2 spacious bedroo
Key facts
- One-car garage
- Twinplex opportunity
- Covered rear porch
Tags
Neighborhood map
What this means for you Summary
Snapshot
- This is a 3 × 4-bed/3.0-bath units multifamily listed at $300k.
Deal economics
- At list price, monthly cash flow is $2k ($26k/yr) — positive. Per door: $735/mo.
- The deal already cash-flows at list — no discount required.
- Meets the 1% rule at list price ($5k rent vs $300k).
- Cap rate 15.1% vs local median 3.5% in Stow — top-decile yield for the area; either an underpriced asset or a hidden risk that comps aren't pricing in. Stress-test before assuming the spread holds.
Location & tenants
- Location reads 76/100 on livability (#217 in OH, #3,390 nationally) — a middle-class / working-renter tenant base. Strengths: schools A+, cost of living A+, housing A+; Watch: amenities F, commute F.
- Stow-Munroe Falls City School District (suburban): math 58% / reading 64% proficiency, ranked #247 of 656 in OH (top 38%) — acceptable for families but not a draw, mixed tenant base, ~2y average lease; only 18% free/reduced lunch — higher-income household profile.
- Market conditions: Rents rising fast (+8.6%/yr); 113 active listings in the ZIP; solid renter incomes; 1,114 units permitted in Summit County in 2024 (397 in 5+ unit buildings).
- At $5,388/mo this rent would consume 69% of the median local household income ($94k/yr) (locally 1165% of renters already pay >50% of income on rent) — very limited rent-growth headroom before tenants either downsize or default.
Forward outlook
- Local home prices are declining (-3.0%/yr); year-one equity from $2k of loan paydown is wiped out by about $9k of value loss. Plan a longer hold.
- Summit County population projected to shrink 6% by 2050 — rents likely to lag national; underwrite the cash flow, not the appreciation.
- At projected returns (-3.0% appreciation + 8.0% rent growth), your $84k cash investment doubles in ~4 years — after that, you're playing with house money.
Negotiation context
- Only 3 days on market — expect competitive offers; lowballing is unlikely to land.
- Current owner paid $184k; list at $300k implies a 63% gain — meaningful room to come down on a strong offer.
Questions for the listing agent
- Can we see the unit-by-unit rent roll, current vacancy, and any below-market leases? What's the average tenancy length?
- What capital expenditures (roof, boiler, parking lot, exteriors) have been made in the last 5 years, and what's planned in the next 2?
- Built in 1971 — when were the roof, HVAC, electrical panel, plumbing, and water heater last replaced?
- Is there a deadline driving the sale (1031 exchange, divorce, estate, relocation)? That informs how much negotiation room exists.
- Schools are A-rated — typically a magnet for longer-tenancy family renters. What's the average tenant stay here, and is there a school-zone premium baked into asking?
- What's the average days-on-market for RENTAL listings here right now (not sales)? A rising rental-DOM trend means longer vacancies and softer asking-rent achievability than the comps imply.
- What's the recent tenant-quality profile in this submarket — average credit score on applications, eviction rate, late-payment / NSF rate, and stable-employment percentage? A property-management company in the area should have these aggregated.
- How much new apartment / multifamily construction is in the pipeline within 1–3 miles? Heavy new supply (>2% of stock underway) typically softens rents 12–24 months out; light construction supports rent growth.
Investment metrics
- 1% rule
- 1.80% ✓
- Cap rate
- 15.12%
- Cash-on-cash
- 31.53%
- DSCR
- 2.40
- GRM
- 4.6
CMA / ARV
- ARV (on-the-fly)
- $358,336
- Comps found
- 1
Show comp detail 1 sale within ~0.75 mi
| Address | Dist | Beds/Ba | Sqft | Sold | Price | $/sf | Match |
|---|---|---|---|---|---|---|---|
| 1235 Homesite Dr | 0.25mi | 4/3.5 | 1,736 (-15%) | 19mo | $306,000 | $176 | 46 |
Match score weights: distance 35% · size 25% · config 20% · recency 20%. Top-matched comps best support the ARV.
Projected returns pro-forma
-3.0% appreciation · 8.0% rent growth · sell at horizon
- IRR
- 32.0%
- Equity multiple
- 2.43×
- Total profit
- $120,469
- Equity at exit
- $44,716
- IRR
- 41.7%
- Equity multiple
- 5.95×
- Total profit
- $415,722
- Equity at exit
- $25,930
Cash invested: $83,972 (down + closing). Projections, not guarantees.
Landlord ↔ Tenant lean methodology
- Overall (STATE)
- 73 Landlord-Friendly
- State Ohio
- 73 Landlord-Friendly · R+6
- County
- — inherits STATE
- City
- — inherits STATE
ZIP-level market 44224
- Rents YoY
- 8.6%
- Active inventory
- 113
- Price-to-rent
- 13.9×
Monthly cashflow live
- Estimated rent
- $5,388 medium interval (Pro) →
- Mortgage (P&I)
- −$1,573
- Tax from tax record
- −$352 /mo · $4,230/yr
- Insurance
- −$125
- HOA
- −$0
- Vacancy / Maint / Mgmt
- −$1,131
- Net cashflow
- $2,206
Break-even live
Sensitivity live
| Price | -10% $2,376 | -5% $2,291 | +0% $2,206 | +5% $2,121 | +10% $2,037 |
|---|---|---|---|---|---|
| Rent | -10% $1,781 | -5% $1,994 | +0% $2,206 | +5% $2,419 | +10% $2,632 |
| Rate | -1.0pp $2,357 | -0.5pp $2,283 | base $2,206 | +0.5pp $2,129 | +1.0pp $2,050 |
3-unit breakdown (identical units grouped — click to expand)
| Units | Beds | Baths | Est. rent |
|---|---|---|---|
| 3× units | 4 | 3 | $5,388 |
| #1 | 4 | 3 | $1,796 |
| #2 | 4 | 3 | $1,796 |
| #3 | 4 | 3 | $1,796 |
| Total (3 units) | $5,388 | ||
UW: 25.0% down · 7.5% · 30yr · 1.5% tax · 5.0% vac · 8.0% maint · 8.0% mgmt
Financing live
Cash to close
- Down payment
- $74,975
- Closing costs
- $8,997
- Reserves months
- —
- Total cash needed
- —
Loan-product check · same deal, 3 products live
Conventional
25% down · 7.5% · 30yr
- Down + closing
- —
- Monthly P&I
- —
- Monthly cashflow
- —
- DSCR
- —
- Eligible?
- —
Personal DTI + credit; lowest rate.
DSCR
20% down · 8.5% · 30yr
- Down + closing
- —
- Monthly P&I
- —
- Monthly cashflow
- —
- DSCR
- —
- Eligible?
- —
No personal income docs; deal must DSCR.
Hard money
10% down · 12.0% · 12mo
- Down + closing
- —
- Monthly P&I
- —
- Monthly cashflow
- —
- DSCR
- —
- Eligible?
- —
Short-term bridge; refi at stabilization.
Listing history 5 events
-
2026-06-18status $299,900 Pending 3 DOM
-
2026-06-18days on market $299,900 Active 3 DOM
-
2026-06-17days on market $299,900 Active 2 DOM
-
2026-06-15remarks 687-char remark
-
2026-06-15$299,900 Active 1 DOM
ⓘ Source: listings_history table (triggers on properties + properties_extension) + one-shot
backfill from property_details.listing_events for pre-trigger history.
Tax reassessment forecast OH · Partial reset (capped growth)
- Current annual tax
- $4,230 · $352/mo
- Projected year-2 tax
- $4,454 · $371/mo
- Expected delta
- +$224/yr (+$19/mo · 5.3%)
ⓘ Screening estimate from a state-policy table — verify with the county assessor before closing.
Climate risk First Street
- Flood 1/10 Low FEMA zone X (unshaded) · 0% chance over 30 yrs
- Wildfire 1/10 Low
- Heat 3/10 Moderate 7 d/yr ≥96°F today · 17 d/yr by 30 yrs out
- Wind 1/10 Low
- Air quality 3/10 Moderate 2 unhealthy d/yr today · 4 by 30 yrs out
Nearby sold comps map
Loading sold comps map…
Walkable amenities ~0.75 mi
Loading nearby amenities…
Taxation est. · year 1
- Rental income
- $64,656
- − Mortgage interest
- −$16,799
- − Property taxes
- −$4,230
- − Insurance
- −$1,500
- − Repairs & maintenance
- −$5,172
- − Management
- −$5,172
- − Depreciation
- −$8,724
- Taxable income
- $23,058
- Est. tax owed @ 24.0%
- −$5,534
- After-tax cash flow
- $20,942/yr
For passive investors: Depreciation is non-cash, so a rental often shows a tax loss while cash-flowing — sheltering income. Rental losses are passive: they offset passive income freely, and up to $25,000/yr can offset ordinary (W-2) income if you actively participate and your MAGI is under $100k (phasing out to $0 by $150k); unused losses carry forward. On sale, claimed depreciation is recaptured at up to 25%, and gains may owe capital-gains tax (a 1031 exchange can defer both). Figures are a year-1 estimate at your 24.0% rate — not tax advice; consult a CPA.
Schools (NCES district)
- District
- Stow-Munroe Falls City School District
- NCES district ID
- 3904483
- Math proficiency
- 58% ▼ -11.00%
- Reading proficiency
- 64% ▼ -6.00%
- Median HH income
- $64,663
- Composite
- 53.29/100
- National rank
- #1488
- State rank
- #247 of 656 in OH
Livability — Stow
- Score
- 76/100
- State rank
- #217
- US rank
- #3390
Category grades
Schools grade is shown separately in the Schools card above.
Census & demographics
- Census place
- Stow, OH
- County
- Summit County · 440,783 people
- City population
- 39,200
- Metro
- Akron, OH
- Population (ZIP)
- 39,200
- Household income
- $94,287
- Rent vs Own
- Severe rent burden
- 1165.0
Population outlook (Summit County) Hauer SSP2
- Today (2025)
- 546,583 people
- By 2030
- 544,028 · -0.5%
- By 2040
- 531,363 · -2.8%
- By 2050
- 514,923 · -5.8%
- By 2075
- 481,765 · -11.9%
- By 2100
- 432,265 · -20.9%
Race, ethnicity, and origin ACS 2023
- Neighborhood character
- Predominantly White (85%)
- Race & ethnicity
- White 85% Two or more races 6% Black 5% Asian 3% Hispanic / Latino 2%
- Common ancestry
- Romanian 6% Slovak 3% Italian 3%
- Foreign-born
- 7% · Canada, China
- Languages at home
- 93% English-only · Arabic 2% Spanish 1% Other Asian/Pacific 1%
Political lean MEDSL · Summit
- 2024 margin
- Lean D (+7.0) · D 53.0% · R 46.0%
- 2008→2024 swing
- -9.6pp toward R · 2008: 16.6pp · 2024: 7.0pp
- All cycles
- 2024: D+7.0 2020: D+9.6 2016: D+8.2 2012: D+14.8 2008: D+16.6
Not yet ingested
- Civics
- —
Market trends
- HPI YoY
- ▼ -218.72%
- Current HPI
- 208.3063
- Rent YoY
- ▲ 8.56%
- Metro
- Akron, OH
- State GDP YoY
- ▲ 1.98%
- F500 in state
- 48
Industry mix (Fortune 500 HQ in OH)
| Industry | F500 HQs | Revenue |
|---|---|---|
| Insurance | 3 | $145B |
|
||
| Industrial Machinery | 3 | $49B |
|
||
| Financial Services | 3 | $24B |
|
||
| Consumer Goods | 2 | $93B |
|
||
| Aerospace / Defense | 2 | $47B |
|
||
| Utilities | 2 | $33B |
|
||
Price history
+63.3% since first listed2 events — show timeline
- 2026-06-15 Listed $299,900 MLSNOW
- 2008-05-21 Sold (Public Records) $183,600 Public Records
Property tax history
+1.3%/yrLatest (2025): $4,230 · -1.6% YoY. Source: county tax records.
Cash-flow waterfall
monthlySold comps — $/sqft
last 12 mo · ≤1 miLoading sold comps…