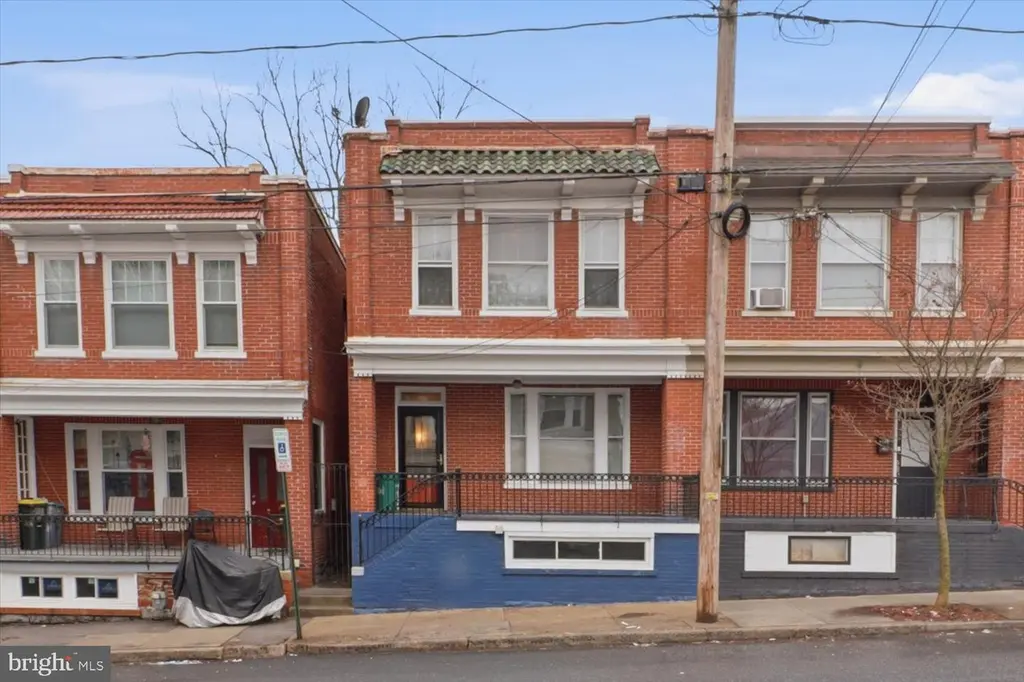
16 S Ann St
Lancaster, PA 17602
$225,000D
3 bd · 2.0 ba ·
1,383 sqft ·
Built 1918
· Townhouse
· Active
· 93 DOM
Cashflow @ list (25.0% down · 7.5%)
Estimated rent
$1,887/mo
Mortgage (P&I)
−$1,180
Tax + insurance
−$335
HOA
−$0
Vac / Maint / Mgmt
−$396
Net cashflow
$-24/mo
Annual
$-292/yr
Cap rate
6.16%
Cash-on-cash
-0.46%
DSCR
0.98
1% rule
0.84%
Cash to close
$63,000
Investor read
- This is a 3-bed/2.0-bath townhouse listed at $225k.
- At list price, monthly cash flow is $-24 ($-292/yr) — negative.
- To cash-flow at today's rent, offer at most $221k (1.9% below list).
- To meet the 1% rule (rent ≥ 1% of price), the offer needs to be $189k (16.1% below list).
- It's been on market 93 days — a 9% lower offer ($205k) is reasonable based on typical stale-listing flexibility.
- Recommended offer: $189k (16.1% below list) — sets the bar for 1% rule.
- Local home prices are declining (-3.0%/yr); year-one equity from $2k of loan paydown is wiped out by about $7k of value loss. Plan a longer hold.
- Location reads 85/100 on livability (#71 in PA, #498 nationally) — a professional / high-income tenant draw. Strengths: amenities A+, commute A+, cost of living A+; Watch: crime C-, employment C-.
- Lancaster SD (urban): math 12% / reading 25% proficiency, ranked #500 of 539 in PA (top 93%) — low school quality limits family demand, transient renter base, plan for 1-2y turnover; 72% free/reduced lunch — lower-income household profile, screen leases tightly.
- Watch-outs: built in 1918 — expect roof / HVAC / electrical / plumbing capex.
- Market conditions: Rents rising (+1.2%/yr); 163 active listings in the ZIP; 40 comparable units currently listed for rent nearby; rentals at typical pace (median 25d on market — plan ~3-4 weeks tenant-placement turnaround); 42% of comp listings sitting > 30 days — soft ceiling on asking rent; solid renter incomes; 1,093 units permitted in Lancaster County in 2024 (201 in 5+ unit buildings).
- Lancaster County population projected at +5% by 2050 — modest demand growth; plan on rents tracking national, not racing it.
- Climate carrying-cost: extreme-heat days projected 7→15/yr by 2055 (HVAC capex compounding) — expect insurance premiums to compound above CPI over the hold.
- Cap rate 6.2% vs local median 4.4% in Lancaster — top-decile yield for the area; either an underpriced asset or a hidden risk that comps aren't pricing in. Stress-test before assuming the spread holds.
Questions for listing agent
- What do current leases actually rent for vs. the listed asking? Can we see a recent rent roll and the last 12 months of T-12 income?
- It's been on market 93 days. Have you received any prior offers? Is the seller open to a 16% concession, seller financing, or rate buy-down credit?
- Built in 1918 — when were the roof, HVAC, electrical panel, plumbing, and water heater last replaced?
- Why hasn't it sold? Are there any deal-killer items the seller is aware of (foundation, flood, title, zoning, code violations)?
- Is there a deadline driving the sale (1031 exchange, divorce, estate, relocation)? That informs how much negotiation room exists.
- The area grade is low — what's the realistic commute time and amenity access for the typical tenant pool here? Any planned neighborhood developments (good or bad) we should know about?
- What's the average days-on-market for RENTAL listings here right now (not sales)? A rising rental-DOM trend means longer vacancies and softer asking-rent achievability than the comps imply.
- What's the recent tenant-quality profile in this submarket — average credit score on applications, eviction rate, late-payment / NSF rate, and stable-employment percentage? A property-management company in the area should have these aggregated.
CashFlowRE · CFR-9CR7AP2VJ51Z96
· Data 1 h ago
cashflowre.app · 2026-05-29