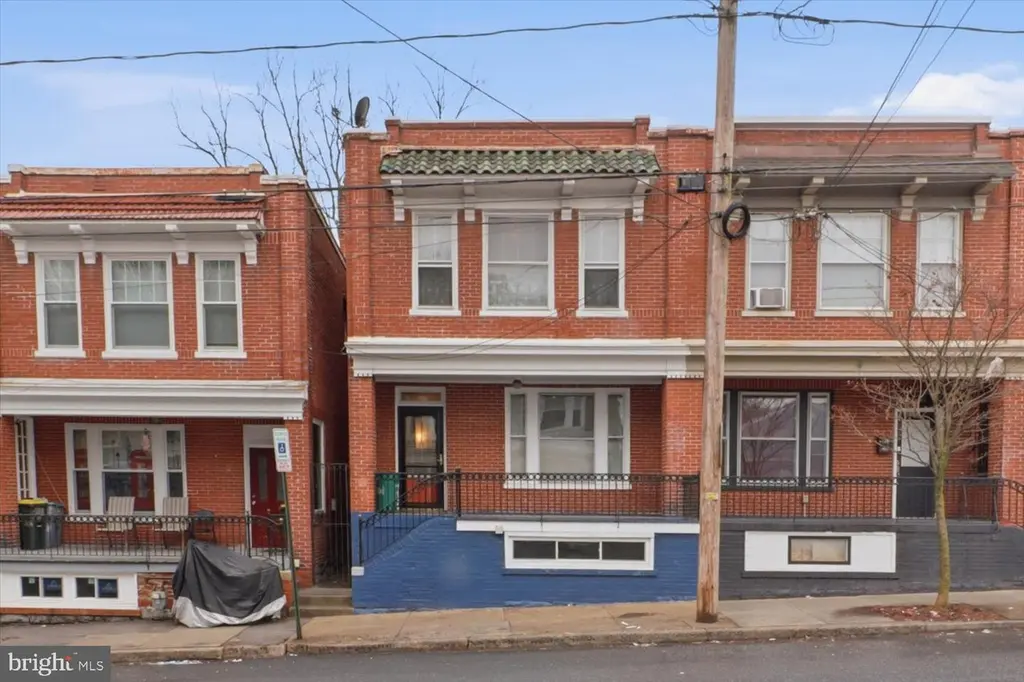
16 S Ann St · Lancaster, PA
Flood risk 1/10 · Minimal
- FEMA flood zone
- X (unshaded)
- Chance of flooding over 30 yrs
- 0.0%
- Est. flood insurance / yr
- $473 – $860
Fire risk 1/10 · Minimal
- Est. fire insurance / yr
- $511 – $949
Heat risk 6/10 · Moderate
- Hot days now (above 101°F)
- 7 days/yr
- Hot days in 30 yrs
- 15 days/yr
Wind risk 4/10 · Minor
- Chance of severe wind over 30 yrs
- 16.0%
Air-quality risk 4/10 · Minor
- Unhealthy air days now
- 4 days/yr
- Unhealthy air days in 30 yrs
- 7 days/yr
Risk factors via First Street. Map © Google.
Why this score? — see what drove the D grade
The composite is a weighted blend of 9 inputs, each scored 0–100. Each bar is that input's sub-score; the figure is the points it added to the 100-point composite (weight × sub-score).
- Cash flow +12.7/30.0
- ARV discount +11.6/15.0
- Livability +4.2/5.0
- DSCR +3.8/10.0
- 1% rule +3.4/10.0
- Rent growth +2.8/5.0
- Condition / age +2.5/5.0
- Schools +1.6/10.0
- Appreciation +0.0/10.0
$225,000
🖨 Deal sheet (PDF) 📄 Offer letter ✓ Due diligence
Listing remarks MLS
Bring our vision! This 2 story 3 bed, 1.5 bath home, owned by the same family for 45+ years is ready for its next chapter! With over 2,000 square feet of living space, features include hardwood floors, tall ceilings, original woodwork, pocket doors and stained glass windows. Spacious layout with good sized bedrooms, galley kitchen and a brick wood burning fireplace. Additional highlights: closed in front porch with wrought iron fencing, fenced yard, stone foundation and newer furnace (approx. 2 years old). Basement offers washer/dryer hookup and a toilet (half bath setup). Being sold as is as part of an estate. Endless potential for the right buyer!
Key facts
- Pocket doors
- Tall ceilings
- Original woodwork
Tags
Neighborhood map
What this means for you Summary
Snapshot
- This is a 3-bed/2.0-bath townhouse listed at $225k.
Deal economics
- At list price, monthly cash flow is $-24 ($-292/yr) — negative.
- To cash-flow at today's rent, offer at most $221k (1.9% below list).
- To meet the 1% rule (rent ≥ 1% of price), the offer needs to be $189k (16.1% below list).
- Recommended offer: $189k (16.1% below list) — sets the bar for 1% rule.
- Cap rate 6.2% vs local median 4.2% in Lancaster — top-decile yield for the area; either an underpriced asset or a hidden risk that comps aren't pricing in. Stress-test before assuming the spread holds.
Location & tenants
- Location reads 85/100 on livability (#71 in PA, #498 nationally) — a professional / high-income tenant draw. Strengths: amenities A+, commute A+, cost of living A+; Watch: crime C-, employment C-.
- Lancaster SD (urban): math 12% / reading 25% proficiency, ranked #500 of 539 in PA (top 93%) — low school quality limits family demand, transient renter base, plan for 1-2y turnover; 72% free/reduced lunch — lower-income household profile, screen leases tightly.
- Market conditions: Rents rising (+1.2%/yr); 161 active listings in the ZIP; 40 comparable units currently listed for rent nearby; rentals at typical pace (median 24d on market — plan ~3-4 weeks tenant-placement turnaround); 42% of comp listings sitting > 30 days — soft ceiling on asking rent; solid renter incomes; 1,093 units permitted in Lancaster County in 2024 (201 in 5+ unit buildings).
Forward outlook
- Local home prices are declining (-3.0%/yr); year-one equity from $2k of loan paydown is wiped out by about $7k of value loss. Plan a longer hold.
- Lancaster County population projected at +5% by 2050 — modest demand growth; plan on rents tracking national, not racing it.
Negotiation context
- It's been on market 90 days — a 6% lower offer ($212k) is reasonable based on typical stale-listing flexibility.
Risks & watch-outs
- Watch-outs: built in 1918 — expect roof / HVAC / electrical / plumbing capex.
- Climate carrying-cost: extreme-heat days projected 7→15/yr by 2055 (HVAC capex compounding) — expect insurance premiums to compound above CPI over the hold.
Questions for the listing agent
- What do current leases actually rent for vs. the listed asking? Can we see a recent rent roll and the last 12 months of T-12 income?
- It's been on market 90 days. Have you received any prior offers? Is the seller open to a 16% concession, seller financing, or rate buy-down credit?
- Built in 1918 — when were the roof, HVAC, electrical panel, plumbing, and water heater last replaced?
- Why hasn't it sold? Are there any deal-killer items the seller is aware of (foundation, flood, title, zoning, code violations)?
- Is there a deadline driving the sale (1031 exchange, divorce, estate, relocation)? That informs how much negotiation room exists.
- The area grade is low — what's the realistic commute time and amenity access for the typical tenant pool here? Any planned neighborhood developments (good or bad) we should know about?
- What's the average days-on-market for RENTAL listings here right now (not sales)? A rising rental-DOM trend means longer vacancies and softer asking-rent achievability than the comps imply.
- What's the recent tenant-quality profile in this submarket — average credit score on applications, eviction rate, late-payment / NSF rate, and stable-employment percentage? A property-management company in the area should have these aggregated.
- How much new for-sale + rental construction is in the pipeline within 1–3 miles? Heavy new supply typically softens prices + rents 12–24 months out; constrained supply supports both.
Investment metrics
- 1% rule
- 0.84% ✗
- Cap rate
- 6.16%
- Cash-on-cash
- -0.46%
- DSCR
- 0.98
- GRM
- 9.9
CMA / ARV
- ARV (median comp)
- $247,313
- List price
- $225,000
- Delta
- -9.02%
- Verdict
- FAIR
- Comps
- 20 within 1.0 mi
Show comp detail 12 sales within ~0.75 mi
| Address | Dist | Beds/Ba | Sqft | Sold | Price | $/sf | Match |
|---|---|---|---|---|---|---|---|
| 345 E Orange St | 0.19mi | 3/1.5 | 1,440 (+4%) | 2mo | $535,000 | $372 | 80 |
| 235 Howard Ave | 0.37mi | 3/2.0 | 1,327 (-4%) | 1mo | $259,900 | $196 | 75 |
| 211 E Chestnut St | 0.40mi | 3/1.5 | 1,429 (+3%) | 1mo | $330,000 | $231 | 73 |
| 1007 E Walnut St | 0.66mi | 3/2.0 | 1,360 (-2%) | 0mo | $285,000 | $210 | 66 |
| 627 E Madison St | 0.44mi | 4/2.5 (+1) | 1,476 (+7%) | 1mo | $300,000 | $203 | 60 |
| 418 Green St | 0.50mi | 3/1.5 | 1,254 (-9%) | 2mo | $215,000 | $171 | 58 |
| 345-1/2 Beaver St | 0.72mi | 4/1.0 (+1) | 1,382 (-0%) | 2mo | $196,200 | $142 | 56 |
| 524 Locust St | 0.59mi | 4/1.0 (+1) | 1,444 (+4%) | 1mo | $213,000 | $148 | 56 |
| 137 S Duke St | 0.46mi | 2/1.5 (-1) | 1,544 (+12%) | 2mo | $429,000 | $278 | 50 |
| 561 Burrowes Ave | 0.69mi | 3/1.0 | 1,272 (-8%) | 1mo | $267,000 | $210 | 50 |
| 521 Hamilton St | 0.68mi | 2/1.0 (-1) | 1,295 (-6%) | 1mo | $230,000 | $178 | 48 |
| 39 W Farnum St | 0.66mi | 4/1.0 (+1) | 1,564 (+13%) | 0mo | $135,000 | $86 | 38 |
Match score weights: distance 35% · size 25% · config 20% · recency 20%. Top-matched comps best support the ARV.
Projected returns pro-forma
-3.0% appreciation · 1.2% rent growth · sell at horizon
- IRR
- -19.1%
- Equity multiple
- 0.34×
- Total profit
- $-41,365
- Equity at exit
- $33,548
- IRR
- -15.7%
- Equity multiple
- 0.19×
- Total profit
- $-51,289
- Equity at exit
- $19,454
Cash invested: $63,000 (down + closing). Projections, not guarantees.
Landlord ↔ Tenant lean methodology
- Overall (STATE)
- 62 Landlord-Friendly
- State Pennsylvania
- 62 Landlord-Friendly · EVEN
- County
- — inherits STATE
- City
- — inherits STATE
ZIP-level market 17602
- Rents YoY
- 1.2%
- Active inventory
- 161
- Price-to-rent
- 9.9×
Monthly cashflow live
- Estimated rent
- $1,887 high interval (Pro) →
- Mortgage (P&I)
- −$1,180
- Tax from tax record
- −$241 /mo · $2,896/yr
- Insurance
- −$94
- HOA
- −$0
- Vacancy / Maint / Mgmt
- −$396
- Net cashflow
- $-24
Break-even live
Sensitivity live
| Price | -10% $103 | -5% $39 | +0% $-24 | +5% $-88 | +10% $-152 |
|---|---|---|---|---|---|
| Rent | -10% $-173 | -5% $-99 | +0% $-24 | +5% $50 | +10% $125 |
| Rate | -1.0pp $89 | -0.5pp $33 | base $-24 | +0.5pp $-83 | +1.0pp $-142 |
UW: 25.0% down · 7.5% · 30yr · 1.5% tax · 5.0% vac · 8.0% maint · 8.0% mgmt
Financing live
Cash to close
- Down payment
- $56,250
- Closing costs
- $6,750
- Reserves months
- —
- Total cash needed
- —
Loan-product check · same deal, 3 products live
Conventional
25% down · 7.5% · 30yr
- Down + closing
- —
- Monthly P&I
- —
- Monthly cashflow
- —
- DSCR
- —
- Eligible?
- —
Personal DTI + credit; lowest rate.
DSCR
20% down · 8.5% · 30yr
- Down + closing
- —
- Monthly P&I
- —
- Monthly cashflow
- —
- DSCR
- —
- Eligible?
- —
No personal income docs; deal must DSCR.
Hard money
10% down · 12.0% · 12mo
- Down + closing
- —
- Monthly P&I
- —
- Monthly cashflow
- —
- DSCR
- —
- Eligible?
- —
Short-term bridge; refi at stabilization.
Rent comps 40 comps
| Address | Beds | Baths | Sqft | Rent | $/sqft | DOM | Units | Dist |
|---|---|---|---|---|---|---|---|---|
| 225 E King St Unit 2 Lancaster, PA | 2.0 | 2.5 | 1075 | $2,600 | $2.42 | 44d | 1 | 0.29mi |
| 225 E King St Unit 1 Lancaster, PA | 2.0 | 1.0 | 957 | $1,950 | $2.04 | 14d | 1 | 0.29mi |
| 231 N Shippen St #224 Lancaster, PA | 2.0 | 2.0 | 1155 | $2,285 | $1.98 | 14d | 1 | 0.37mi |
| 708 S Lime St Unit 3 Lancaster, PA | 4.0 | 1.0 | 1742 | $1,850 | $1.06 | 44d | 1 | 0.43mi |
| 738 E Madison St Lancaster, PA | 3.0 | 1.0 | 1102 | $1,750 | $1.59 | 44d | 1 | 0.46mi |
| 202 N Queen St Lancaster, PA | 2.0 | 1.0–2.0 | 697 | $2,718 | $3.90 | 14d | 12 | 0.64mi |
| 537 Woodward St Lancaster, PA | 3.0 | 2.0 | 1288 | $1,650 | $1.28 | 24d | 1 | 0.65mi |
| 549 Howard Ave Lancaster, PA | 4.0 | 1.0 | 1439 | $1,700 | $1.18 | 44d | 1 | 0.66mi |
| 49 W Farnum St Lancaster, PA | 3.0 | 1.0 | 1820 | $1,650 | $0.91 | 44d | 1 | 0.69mi |
| 118 N Prince St Lancaster, PA | 1.0–3.0 | 1.0–3.0 | 1274 | $4,703 | $3.69 | 14d | 48 | 0.72mi |
| 345 1/2 Beaver St Lancaster, PA | 4.0 | 1.0 | 1382 | $2,095 | $1.52 | 44d | 1 | 0.74mi |
| 404 Beaver St Lancaster, PA | 3.0 | 1.0 | 1025 | $1,425 | $1.39 | 24d | 1 | 0.78mi |
| 214 W Strawberry St Lancaster, PA | 3.0 | 1.0 | 1175 | $1,345 | $1.14 | 22d | 1 | 0.81mi |
| 631 E Frederick St Lancaster, PA | 3.0 | 1.0 | 1830 | $1,850 | $1.01 | 44d | 1 | 0.81mi |
| 425 N Prince St Apt 206 Lancaster, PA | 2.0 | 2.0 | 1138 | $1,995 | $1.75 | 44d | 1 | 0.82mi |
| 766 New Holland Ave Lancaster, PA | 3.0 | 1.0 | 1152 | $1,795 | $1.56 | 14d | 1 | 0.84mi |
| 128 N Mulberry St Unit 1 Lancaster, PA | 2.0 | 2.0 | 1500 | $2,250 | $1.50 | 24d | 1 | 0.87mi |
| 1216 Clark St Lancaster, PA | 4.0 | 1.5 | 1270 | $2,195 | $1.73 | 14d | 1 | 0.91mi |
| 836 N Plum St Lancaster, PA | 3.0 | 2.0 | 1602 | $2,150 | $1.34 | 14d | 1 | 0.92mi |
| 422 Hillside Ave Lancaster, PA | 2.0 | 1.0 | 960 | $1,245 | $1.30 | 44d | 1 | 0.96mi |
| 513 Poplar St Lancaster, PA | 3.0 | 1.5 | 1184 | $1,695 | $1.43 | 44d | 1 | 0.97mi |
| 37 E Filbert St Lancaster, PA | 3.0 | 1.0 | 1002 | $1,750 | $1.75 | 44d | 1 | 1.00mi |
| 324 New Dorwart St Lancaster, PA | 3.0 | 1.0 | 1020 | $1,495 | $1.47 | 14d | 1 | 1.00mi |
| 135 E Ross St Unit 2nd Floor Lancaster, PA | 2.0 | 1.0 | 1000 | $1,575 | $1.57 | 14d | 1 | 1.01mi |
| 337 W Lemon St Unit 2 Lancaster, PA | 3.0 | 1.0 | 1588 | $1,895 | $1.19 | 14d | 1 | 1.02mi |
| 701 Martha Ave Lancaster, PA | 2.0 | 1.0–2.0 | 1096 | $2,600 | $2.37 | 14d | 1 | 1.03mi |
| 609 Saint Joseph St Lancaster, PA | 4.0 | 2.0 | 1523 | $1,695 | $1.11 | 44d | 1 | 1.06mi |
| 433 W Walnut St Apt 2 Lancaster, PA | 2.0 | 1.0 | 900 | $1,840 | $2.04 | 24d | 1 | 1.07mi |
| 529 Manor St Lancaster, PA | 3.0 | 1.0 | 1434 | $1,635 | $1.14 | 14d | 1 | 1.08mi |
| 850 Highland Ave Lancaster, PA | 2.0 | 1.0 | 1000 | $1,300 | $1.30 | 22d | 1 | 1.13mi |
| 816 N Prince St Lancaster, PA | 1.0–2.0 | 1.0–2.0 | 794 | $2,195 | $2.76 | 14d | 7 | 1.14mi |
| 860 N Market St Lancaster, PA | 3.0 | 2.0 | 1514 | $1,850 | $1.22 | 44d | 1 | 1.15mi |
| 2500 Hickory Dr Lancaster, PA | 2.0 | 2.5 | 1711 | $2,650 | $1.55 | 14d | 1 | 1.24mi |
| 14 Coral St Lancaster, PA | 3.0 | 1.5 | 1355 | $1,525 | $1.13 | 44d | 1 | 1.24mi |
| 520 W Frederick St Lancaster, PA | 4.0 | 1.0 | 1713 | $1,895 | $1.11 | 44d | 1 | 1.26mi |
| 678 1/2 Columbia Ave Apt 2 Lancaster, PA | 3.0 | 1.0 | 1100 | $1,495 | $1.36 | 14d | 1 | 1.31mi |
| 741 Manor St Lancaster, PA | 3.0 | 1.0 | 1200 | $1,695 | $1.41 | 44d | 1 | 1.33mi |
| 1013 Willow Street Pike Lancaster, PA | 2.0 | 1.0 | 1144 | $1,499 | $1.31 | 14d | 1 | 1.37mi |
| 862 Pleasure Rd Lancaster, PA | 3.0 | 1.5 | 1707 | $2,300 | $1.35 | 44d | 1 | 1.37mi |
| 40 Fairview Ave Lancaster, PA | 3.0 | 1.0 | 1152 | $1,700 | $1.48 | 14d | 1 | 1.37mi |
Listing history 16 events
-
2026-06-18days on market $225,000 Active 90 DOM
-
2026-06-17days on market $225,000 Active 89 DOM
-
2026-06-16days on market $225,000 Active 88 DOM
-
2026-06-15days on market $225,000 Active 87 DOM
-
2026-06-14days on market $225,000 Active 85 DOM
-
2026-06-13days on market $225,000 Active 84 DOM
-
2026-06-10days on market $225,000 Active 82 DOM
-
2026-06-09days on market $225,000 Active 81 DOM
-
2026-06-08days on market $225,000 Active 80 DOM
-
2026-06-07days on market $225,000 Active 79 DOM
-
2026-06-03days on market $225,000 Active 75 DOM
-
2026-06-02days on market $225,000 Active 74 DOM
-
2026-06-01days on market $225,000 Active 73 DOM
-
2026-05-31days on market $225,000 Active 72 DOM
-
2026-05-30days on market $225,000 Active 71 DOM
-
2026-03-20$225,000 Active 657-char remark
Show marketing remark (657 chars)
Bring our vision! This 2 story 3 bed, 1.5 bath home, owned by the same family for 45+ years is ready for its next chapter! With over 2,000 square feet of living space, features include hardwood floors, tall ceilings, original woodwork, pocket doors and stained glass windows. Spacious layout with good sized bedrooms, galley kitchen and a brick wood burning fireplace. Additional highlights: closed in front porch with wrought iron fencing, fenced yard, stone foundation and newer furnace (approx. 2 years old). Basement offers washer/dryer hookup and a toilet (half bath setup). Being sold as is as part of an estate. Endless potential for the right buyer!
ⓘ Source: listings_history table (triggers on properties + properties_extension) + one-shot
backfill from property_details.listing_events for pre-trigger history.
Tax reassessment forecast PA · Partial reset (capped growth)
- Current annual tax
- $2,896 · $241/mo
- Projected year-2 tax
- $3,226 · $269/mo
- Expected delta
- +$329/yr (+$27/mo · 11.4%)
ⓘ Screening estimate from a state-policy table — verify with the county assessor before closing.
Climate risk First Street
- Flood 1/10 Low FEMA zone X (unshaded) · 0% chance over 30 yrs
- Wildfire 1/10 Low
- Heat 6/10 Major 7 d/yr ≥101°F today · 15 d/yr by 30 yrs out
- Wind 4/10 Moderate 16% chance of damaging wind over 30 yrs
- Air quality 4/10 Moderate 4 unhealthy d/yr today · 7 by 30 yrs out
Nearby sold comps map
Loading sold comps map…
Walkable amenities ~0.75 mi
Loading nearby amenities…
Taxation est. · year 1
- Rental income
- $22,643
- − Mortgage interest
- −$12,603
- − Property taxes
- −$2,896
- − Insurance
- −$1,125
- − Repairs & maintenance
- −$1,811
- − Management
- −$1,811
- − Depreciation
- −$6,545
- Taxable loss
- −$4,150
- Est. tax savings @ 24.0%
- +$996
- After-tax cash flow
- $704/yr
For passive investors: Depreciation is non-cash, so a rental often shows a tax loss while cash-flowing — sheltering income. Rental losses are passive: they offset passive income freely, and up to $25,000/yr can offset ordinary (W-2) income if you actively participate and your MAGI is under $100k (phasing out to $0 by $150k); unused losses carry forward. On sale, claimed depreciation is recaptured at up to 25%, and gains may owe capital-gains tax (a 1031 exchange can defer both). Figures are a year-1 estimate at your 24.0% rate — not tax advice; consult a CPA.
Schools (NCES district)
- District
- Lancaster SD
- NCES district ID
- 4213140
- Math proficiency
- 12% ▼ -10.00%
- Reading proficiency
- 25% ▼ -13.00%
- Median HH income
- $38,500
- Composite
- 15.52/100
- National rank
- #9301
- State rank
- #500 of 539 in PA
Livability — Lancaster
- Score
- 85/100
- State rank
- #71
- US rank
- #498
Category grades
Schools grade is shown separately in the Schools card above.
Census & demographics
- Census place
- Lancaster, PA
- County
- Lancaster County · 390,309 people
- City population
- 176,170
- Metro
- Lancaster, PA
- Population (ZIP)
- 52,217
- Household income
- $75,862
- Rent vs Own
- Severe rent burden
- 1556.0
Population outlook (Lancaster County) Hauer SSP2
- Today (2025)
- 561,011 people
- By 2030
- 570,969 · +1.8%
- By 2040
- 585,929 · +4.4%
- By 2050
- 591,056 · +5.4%
- By 2075
- 594,747 · +6.0%
- By 2100
- 558,850 · -0.4%
Race, ethnicity, and origin ACS 2023
- Neighborhood character
- Diverse neighborhood (Simpson 0.61)
- Race & ethnicity
- White 52% Hispanic / Latino 32% Two or more races 12% Black 11% Asian 2%
- Hispanic origin (detail)
- Mexican 2% Puerto Rican 21% Cuban 1% Dominican 4%
- Common ancestry
- Romanian 2% Italian 1% Lithuanian 1%
- Foreign-born
- 13% · Canada, Vietnam, South Korea
- Languages at home
- 70% English-only · Spanish 22% German/W. Germanic 2% French/Haitian/Cajun 1%
Political lean MEDSL · Lancaster
- 2024 margin
- R (+15.9) · D 41.5% · R 57.5%
- 2008→2024 swing
- -4.1pp toward R · 2008: -11.8pp · 2024: -15.9pp
- All cycles
- 2024: R+15.9 2020: R+15.8 2016: R+19.7 2012: R+19.2 2008: R+11.8
Not yet ingested
- Civics
- —
Market trends
- HPI YoY
- ▼ -248.05%
- Current HPI
- 288.9141
- Rent YoY
- ▲ 1.20%
- Metro
- Lancaster, PA
- State GDP YoY
- ▲ 1.68%
- F500 in state
- 34
Industry mix (Fortune 500 HQ in PA)
| Industry | F500 HQs | Revenue |
|---|---|---|
| Healthcare | 2 | $309B |
|
||
| Insurance | 2 | $27B |
|
||
| Telecommunications / Media | 1 | $124B |
|
||
| Industrial Distribution | 1 | $22B |
|
||
| Financial Services | 1 | $20B |
|
||
| Chemicals / Materials | 1 | $18B |
|
||
Price history
1 event — show timeline
- 2026-03-20 Listed $225,000 BRIGHT MLS
Property tax history
+0.8%/yrLatest (2026): $2,896 · +3.3% YoY. Source: county tax records.
Cash-flow waterfall
monthlySold comps — $/sqft
last 12 mo · ≤1 miLoading sold comps…