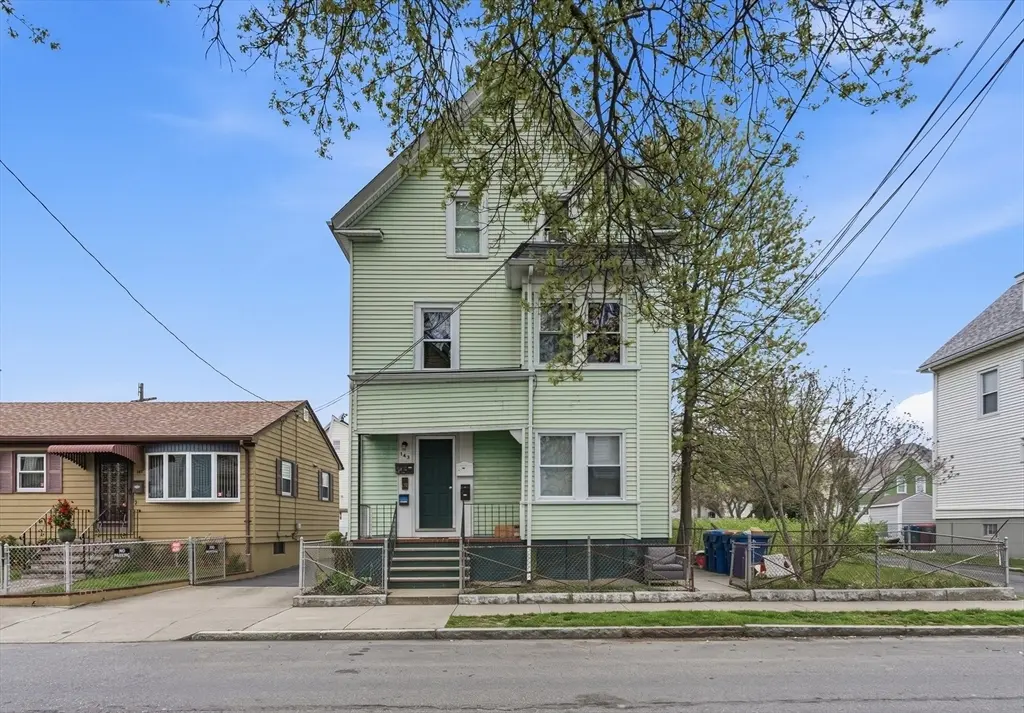
143 Division St
New Bedford, MA 02744
$624,999C
8 bd · 3.0 ba ·
3,094 sqft ·
Built 1895
· MultiFamily
· Active
· 9 DOM
Cashflow @ list (25.0% down · 7.5%)
Estimated rent
$5,571/mo
Mortgage (P&I)
−$3,278
Tax + insurance
−$597
HOA
−$0
Vac / Maint / Mgmt
−$1,170
Net cashflow
$526/mo
Annual
$6,313/yr
Cap rate
7.30%
Cash-on-cash
3.61%
DSCR
1.16
1% rule
0.89%
Cash to close
$175,000
Investor read
- This is a 3 × 3-bed/1.0-bath units multifamily listed at $625k.
- At list price, monthly cash flow is $526 ($6k/yr) — positive. Per door: $175/mo.
- The deal already cash-flows at list — no discount required.
- To meet the 1% rule (rent ≥ 1% of price), the offer needs to be $557k (10.9% below list).
- Only 9 days on market — expect competitive offers; lowballing is unlikely to land.
- Recommended offer: $557k (10.9% below list) — sets the bar for 1% rule.
- In year one you build about $46k of equity ($4k loan paydown + $42k appreciation (6.7% local appreciation)).
- Location reads 67/100 on livability (#155 in MA) — a middle-class / working-renter tenant base. Strengths: health & safety A+, housing B+; Watch: cost of living C-, employment D, amenities F.
- New Bedford (suburban): math 17% / reading 28% proficiency, ranked #287 of 302 in MA (top 95%) — low school quality limits family demand, transient renter base, plan for 1-2y turnover; 65% free/reduced lunch — lower-income household profile, screen leases tightly.
- Zoned schools: Roosevelt Middle School (math 11% / reading 20%, grade F, #273 of 305 statewide, top 89%, 778 students, 0% FRL); New Bedford High (math 13% / reading 25%, grade F, #313 of 343 statewide, top 92%, 2,898 students, 0% FRL) — zoned schools average 0% FRL vs 65% district-wide (65 pts lower); this property's tenant base skews higher-income than the district average.
- Watch-outs: built in 1895 — expect roof / HVAC / electrical / plumbing capex.
- Market conditions: 22 active listings in the ZIP; 760 units permitted in Bristol County in 2024 (142 in 5+ unit buildings).
- Bristol County population projected to shrink 3% by 2050 — rents likely to lag national; underwrite the cash flow, not the appreciation.
- 5 sale attempts since 21y ago with the ask held roughly flat each time — persistent listings suggest the price (not the market) is what's stuck; bring a comps-based counter.
- Current owner paid $300k; list at $625k implies a 108% gain — meaningful room to come down on a strong offer.
- At projected returns (6.7% appreciation + 3.0% rent growth), your $175k cash investment doubles in ~4 years — after that, you're playing with house money.
- By year 2, paydown + projected appreciation supports a ~$73k cash-out refi (75% LTV) — recoverable capital for the next deal without selling this one.
- Climate carrying-cost: major flood risk; severe wind risk, 80% chance of damaging wind over 30y; extreme-heat days projected 7→16/yr by 2055 (HVAC capex compounding) — expect insurance premiums to compound above CPI over the hold.
Questions for listing agent
- Can we see the unit-by-unit rent roll, current vacancy, and any below-market leases? What's the average tenancy length?
- What capital expenditures (roof, boiler, parking lot, exteriors) have been made in the last 5 years, and what's planned in the next 2?
- Built in 1895 — when were the roof, HVAC, electrical panel, plumbing, and water heater last replaced?
- Is there a deadline driving the sale (1031 exchange, divorce, estate, relocation)? That informs how much negotiation room exists.
- Schools are D-rated, which usually means shorter tenancies and higher turnover. Who's the typical renter profile here, and what's been the actual vacancy rate?
- What's the average days-on-market for RENTAL listings here right now (not sales)? A rising rental-DOM trend means longer vacancies and softer asking-rent achievability than the comps imply.
- What's the recent tenant-quality profile in this submarket — average credit score on applications, eviction rate, late-payment / NSF rate, and stable-employment percentage? A property-management company in the area should have these aggregated.
- How much new apartment / multifamily construction is in the pipeline within 1–3 miles? Heavy new supply (>2% of stock underway) typically softens rents 12–24 months out; light construction supports rent growth.
CashFlowRE · CFR-9ESM80CFA7QFEV
· Data 3 days ago
cashflowre.app · 2026-05-29