 Triplex
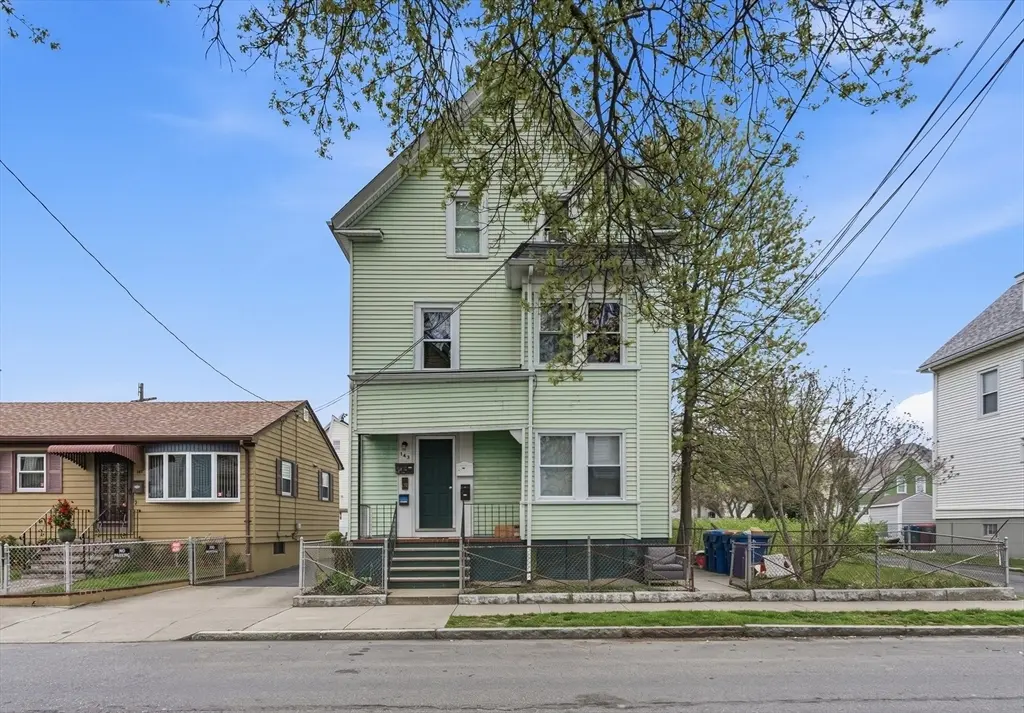
143 Division St · New Bedford, MA
Flood risk 6/10 · Moderate
- FEMA flood zone
- X
- Chance of flooding over 30 yrs
- 0.68%
- Est. flood insurance / yr
- $473 – $860
Fire risk 1/10 · Minimal
- Est. fire insurance / yr
- $915 – $1,699
Heat risk 5/10 · Moderate
- Hot days now (above 94°F)
- 7 days/yr
- Hot days in 30 yrs
- 16 days/yr
Wind risk 8/10 · Major
- Chance of severe wind over 30 yrs
- 80.0%
Air-quality risk 2/10 · Minimal
- Unhealthy air days now
- 1 days/yr
- Unhealthy air days in 30 yrs
- 2 days/yr
Risk factors via First Street. Map © Google.
Why this score? — see what drove the C grade
The composite is a weighted blend of 9 inputs, each scored 0–100. Each bar is that input's sub-score; the figure is the points it added to the 100-point composite (weight × sub-score).
- Cash flow +17.9/30.0
- ARV discount +11.0/15.0
- Appreciation +8.3/10.0
- DSCR +5.6/10.0
- 1% rule +3.9/10.0
- Livability +3.4/5.0
- Rent growth +2.5/5.0
- Condition / age +2.5/5.0
- Schools +1.9/10.0
$624,999
🖨 Deal sheet (PDF) 📄 Offer letter ✓ Due diligence
Multi-family units
County records classify this as Multi-Family (2-4 Unit). Listing-text estimate: 3 units. confirmed
Listing remarks MLS
Whether you're a new Investor or someone looking to add to their portfolio, this fully rented, well-kept 3 family is the perfect investment opportunity. This property has a newer roof and been recently updated on both interior and exterior. 1st and 2nd floors are 3 bedroom units, spacious 3rd floor unit is a 2 bedroom & has a fenced in yard.
Key facts
- South end location
- Strong rental demand
- Newer boilers
Tags
Property features AI
Finance
- Other: Building area approximately 3,052 total square feet; Lot size approximately 0.08 acres; Located in a neighborhood with public transportation, shopping, parks, medical facility, laundromat, highway access, house of worship, marina, private and public schools, and sidewalks
Exterior
- Parking: Open parking available
- Utilities: Public water; Public sewer; Circuit breaker electrical service; Gas available for range; Solar system produces ~3,710 kWh annually (3.2 kW size), installed 2022; approx. $90/month lease
- Home design: 3-family building (3 units, up/down); 3 stories; Green exterior color; Solar energy system installed (2022)
- Construction: Frame construction; Stone foundation; Shingle roof; Built (year per public records)
- Exterior features: Fenced/enclosed yard; Porch; Level lot; Paved, public road frontage
Interior
- Flooring: Vinyl flooring; Carpet flooring
- Bathrooms: 3 full bathrooms
- Heating & cooling: 3 heating units; No central cooling units
- Interior features: 15 total rooms; Full, unfinished basement; Rain gutters
Neighborhood map
What this means for you Summary
Snapshot
- This is a 3 × 3-bed/1.0-bath units multifamily listed at $625k.
Deal economics
- At list price, monthly cash flow is $526 ($6k/yr) — positive. Per door: $175/mo.
- The deal already cash-flows at list — no discount required.
- To meet the 1% rule (rent ≥ 1% of price), the offer needs to be $557k (10.9% below list).
- Recommended offer: $557k (10.9% below list) — sets the bar for 1% rule.
Location & tenants
- Location reads 67/100 on livability (#155 in MA) — a middle-class / working-renter tenant base. Strengths: health & safety A+, housing B+; Watch: cost of living C-, employment D, amenities F.
- New Bedford (suburban): math 17% / reading 28% proficiency, ranked #287 of 302 in MA (top 95%) — low school quality limits family demand, transient renter base, plan for 1-2y turnover; 65% free/reduced lunch — lower-income household profile, screen leases tightly.
- Zoned schools: Roosevelt Middle School (math 11% / reading 20%, grade F, #273 of 305 statewide, top 89%, 778 students, 0% FRL); New Bedford High (math 13% / reading 25%, grade F, #313 of 343 statewide, top 92%, 2,898 students, 0% FRL) — zoned schools average 0% FRL vs 65% district-wide (65 pts lower); this property's tenant base skews higher-income than the district average.
- Market conditions: 22 active listings in the ZIP; 760 units permitted in Bristol County in 2024 (142 in 5+ unit buildings).
Forward outlook
- In year one you build about $46k of equity ($4k loan paydown + $42k appreciation (6.7% local appreciation)).
- Bristol County population projected to shrink 3% by 2050 — rents likely to lag national; underwrite the cash flow, not the appreciation.
- At projected returns (6.7% appreciation + 3.0% rent growth), your $175k cash investment doubles in ~4 years — after that, you're playing with house money.
- By year 2, paydown + projected appreciation supports a ~$73k cash-out refi (75% LTV) — recoverable capital for the next deal without selling this one.
Negotiation context
- Only 9 days on market — expect competitive offers; lowballing is unlikely to land.
- 5 sale attempts since 21y ago with the ask held roughly flat each time — persistent listings suggest the price (not the market) is what's stuck; bring a comps-based counter.
- Current owner paid $300k; list at $625k implies a 108% gain — meaningful room to come down on a strong offer.
Risks & watch-outs
- Watch-outs: built in 1895 — expect roof / HVAC / electrical / plumbing capex.
- Climate carrying-cost: major flood risk; severe wind risk, 80% chance of damaging wind over 30y; extreme-heat days projected 7→16/yr by 2055 (HVAC capex compounding) — expect insurance premiums to compound above CPI over the hold.
Questions for the listing agent
- Can we see the unit-by-unit rent roll, current vacancy, and any below-market leases? What's the average tenancy length?
- What capital expenditures (roof, boiler, parking lot, exteriors) have been made in the last 5 years, and what's planned in the next 2?
- Built in 1895 — when were the roof, HVAC, electrical panel, plumbing, and water heater last replaced?
- Is there a deadline driving the sale (1031 exchange, divorce, estate, relocation)? That informs how much negotiation room exists.
- Schools are D-rated, which usually means shorter tenancies and higher turnover. Who's the typical renter profile here, and what's been the actual vacancy rate?
- What's the average days-on-market for RENTAL listings here right now (not sales)? A rising rental-DOM trend means longer vacancies and softer asking-rent achievability than the comps imply.
- What's the recent tenant-quality profile in this submarket — average credit score on applications, eviction rate, late-payment / NSF rate, and stable-employment percentage? A property-management company in the area should have these aggregated.
- How much new apartment / multifamily construction is in the pipeline within 1–3 miles? Heavy new supply (>2% of stock underway) typically softens rents 12–24 months out; light construction supports rent growth.
Investment metrics
- 1% rule
- 0.89% ✗
- Cap rate
- 7.30%
- Cash-on-cash
- 3.61%
- DSCR
- 1.16
- GRM
- 9.3
CMA / ARV
- ARV (on-the-fly)
- $677,586
- Comps found
- 12
Show comp detail 12 sales within ~0.75 mi
| Address | Dist | Beds/Ba | Sqft | Sold | Price | $/sf | Match |
|---|---|---|---|---|---|---|---|
| 27 Nelson St | 0.08mi | 9/3.0 (+1) | 3,042 (-2%) | 2mo | $665,000 | $219 | 87 |
| 2 Rockland St | 0.36mi | 9/3.0 (+1) | 3,022 (-2%) | 2mo | $695,000 | $230 | 72 |
| 9 Stapleton St | 0.23mi | 9/3.0 (+1) | 3,321 (+7%) | 2mo | $665,000 | $200 | 70 |
| 67 Roosevelt | 0.61mi | 8/3.0 | 3,033 (-2%) | 4mo | $500,000 | $165 | 65 |
| 32 Sagamore St | 0.44mi | 9/3.0 (+1) | 3,321 (+7%) | 1mo | $745,000 | $224 | 62 |
| 126 Fair St | 0.49mi | 9/3.0 (+1) | 3,321 (+7%) | 6mo | $421,000 | $127 | 56 |
| 136 Dartmouth St | 0.59mi | 9/3.0 (+1) | 3,348 (+8%) | 4mo | $650,000 | $194 | 51 |
| 98-100 South St | 0.44mi | 9/3.0 (+1) | 2,732 (-12%) | 6mo | $680,000 | $249 | 50 |
| 230 Frank St | 0.67mi | 8/3.0 | 2,735 (-12%) | 1mo | $599,000 | $219 | 48 |
| 46 Sagamore St | 0.47mi | 9/3.0 (+1) | 3,504 (+13%) | 5mo | $625,000 | $178 | 47 |
| 52 Swift St | 0.45mi | 9/3.5 (+1) | 2,682 (-13%) | 5mo | $640,000 | $239 | 46 |
| 103 David St | 0.62mi | 8/4.0 | 3,488 (+13%) | 3mo | $600,000 | $172 | 44 |
Match score weights: distance 35% · size 25% · config 20% · recency 20%. Top-matched comps best support the ARV.
Projected returns pro-forma
6.66% appreciation · 3.0% rent growth · sell at horizon
- IRR
- 19.8%
- Equity multiple
- 2.36×
- Total profit
- $238,428
- Equity at exit
- $419,131
- IRR
- 18.8%
- Equity multiple
- 4.82×
- Total profit
- $669,192
- Equity at exit
- $783,813
Cash invested: $175,000 (down + closing). Projections, not guarantees.
Landlord ↔ Tenant lean methodology
- Overall (STATE)
- 20 Strongly Tenant-Friendly
- State Massachusetts
- 20 Strongly Tenant-Friendly · D+15
- County
- — inherits STATE
- City
- — inherits STATE
ZIP-level market 02744
- Home prices YoY
- 1.6%
- Active inventory
- 22
- Price-to-rent
- 28.0×
Monthly cashflow live
- Estimated rent
- $5,571 high interval (Pro) →
- Mortgage (P&I)
- −$3,278
- Tax from tax record
- −$337 /mo · $4,044/yr
- Insurance
- −$260
- HOA
- −$0
- Vacancy / Maint / Mgmt
- −$1,170
- Net cashflow
- $526
Break-even live
Sensitivity live
| Price | -10% $880 | -5% $703 | +0% $526 | +5% $349 | +10% $172 |
|---|---|---|---|---|---|
| Rent | -10% $86 | -5% $306 | +0% $526 | +5% $746 | +10% $966 |
| Rate | -1.0pp $841 | -0.5pp $685 | base $526 | +0.5pp $364 | +1.0pp $199 |
3-unit breakdown (identical units grouped — click to expand)
| Units | Beds | Baths | Est. rent |
|---|---|---|---|
| 3× units | 3 | 1 | $5,571 |
| #1 | 3 | 1 | $1,857 |
| #2 | 3 | 1 | $1,857 |
| #3 | 3 | 1 | $1,857 |
| Total (3 units) | $5,571 | ||
UW: 25.0% down · 7.5% · 30yr · 1.5% tax · 5.0% vac · 8.0% maint · 8.0% mgmt
Financing live
Cash to close
- Down payment
- $156,250
- Closing costs
- $18,750
- Reserves months
- —
- Total cash needed
- —
Loan-product check · same deal, 3 products live
Conventional
25% down · 7.5% · 30yr
- Down + closing
- —
- Monthly P&I
- —
- Monthly cashflow
- —
- DSCR
- —
- Eligible?
- —
Personal DTI + credit; lowest rate.
DSCR
20% down · 8.5% · 30yr
- Down + closing
- —
- Monthly P&I
- —
- Monthly cashflow
- —
- DSCR
- —
- Eligible?
- —
No personal income docs; deal must DSCR.
Hard money
10% down · 12.0% · 12mo
- Down + closing
- —
- Monthly P&I
- —
- Monthly cashflow
- —
- DSCR
- —
- Eligible?
- —
Short-term bridge; refi at stabilization.
Listing history 7 events
-
2026-06-18days on market $624,999 Active 9 DOM
-
2026-06-17days on market $624,999 Active 8 DOM
-
2026-06-16days on market $624,999 Active 7 DOM
-
2026-06-15days on market $624,999 Active 6 DOM
-
2026-06-13statusdays on market $624,999 Active 4 DOM
-
2026-06-10remarks 699-char remark
-
2026-06-10$624,999 New 1 DOM
ⓘ Source: listings_history table (triggers on properties + properties_extension) + one-shot
backfill from property_details.listing_events for pre-trigger history.
Tax reassessment forecast MA · Partial reset (capped growth)
- Current annual tax
- $4,044 · $337/mo
- Projected year-2 tax
- $5,866 · $489/mo
- Expected delta
- +$1,822/yr (+$152/mo · 45.0%)
ⓘ Screening estimate from a state-policy table — verify with the county assessor before closing.
Climate risk First Street
- Flood 6/10 Major FEMA zone X · 68% chance over 30 yrs
- Wildfire 1/10 Low
- Heat 5/10 Major 7 d/yr ≥94°F today · 16 d/yr by 30 yrs out
- Wind 8/10 Severe 80% chance of damaging wind over 30 yrs
- Air quality 2/10 Low 1 unhealthy d/yr today · 2 by 30 yrs out
Nearby sold comps map
Loading sold comps map…
Walkable amenities ~0.75 mi
Loading nearby amenities…
Taxation est. · year 1
- Rental income
- $66,852
- − Mortgage interest
- −$35,010
- − Property taxes
- −$4,044
- − Insurance
- −$3,125
- − Repairs & maintenance
- −$5,348
- − Management
- −$5,348
- − Depreciation
- −$18,182
- Taxable loss
- −$4,205
- Est. tax savings @ 24.0%
- +$1,009
- After-tax cash flow
- $7,322/yr
For passive investors: Depreciation is non-cash, so a rental often shows a tax loss while cash-flowing — sheltering income. Rental losses are passive: they offset passive income freely, and up to $25,000/yr can offset ordinary (W-2) income if you actively participate and your MAGI is under $100k (phasing out to $0 by $150k); unused losses carry forward. On sale, claimed depreciation is recaptured at up to 25%, and gains may owe capital-gains tax (a 1031 exchange can defer both). Figures are a year-1 estimate at your 24.0% rate — not tax advice; consult a CPA.
Schools (NCES district)
- District
- New Bedford
- NCES district ID
- 2508430
- Math proficiency
- 17% ▼ -14.00%
- Reading proficiency
- 28% ▼ -6.00%
- Median HH income
- $37,901
- Composite
- 18.79/100
- National rank
- #8869
- State rank
- #287 of 302 in MA
Livability — New Bedford
- Score
- 67/100
- State rank
- #155
- US rank
- #10150
Category grades
Schools grade is shown separately in the Schools card above.
Census & demographics
- Census place
- New Bedford, MA
- County
- Bristol County · 342,083 people
- City population
- 76,528
- Metro
- Providence-Warwick, RI-MA
- Population (ZIP)
- 12,716
- Household income
- $58,675
- Rent vs Own
- Severe rent burden
- 811.0
Population outlook (Bristol County) Hauer SSP2
- Today (2025)
- 570,212 people
- By 2030
- 571,181 · +0.2%
- By 2040
- 565,389 · -0.8%
- By 2050
- 552,141 · -3.2%
- By 2075
- 520,923 · -8.6%
- By 2100
- 474,363 · -16.8%
Race, ethnicity, and origin ACS 2023
- Neighborhood character
- Diverse neighborhood (Simpson 0.61)
- Race & ethnicity
- White 57% Hispanic / Latino 27% Two or more races 20% Black 4%
- Hispanic origin (detail)
- Puerto Rican 17% Dominican 2%
- Common ancestry
- Russian 34% Lithuanian 5% Romanian 3%
- Foreign-born
- 24% · Canada
- Languages at home
- 57% English-only · Other Indo-European 22% Spanish 17% French/Haitian/Cajun 3%
Political lean MEDSL · Bristol
- 2024 margin
- Toss-up / Even · D 49.8% · R 48.5% · Other 1.8%
- 2008→2024 swing
- -21.9pp toward R · 2008: 23.2pp · 2024: 1.3pp
- All cycles
- 2024: D+1.3 2020: D+12.0 2016: D+9.3 2012: D+20.5 2008: D+23.2
Not yet ingested
- Civics
- —
Market trends
- HPI YoY
- ▲ 6.66%
- Current HPI
- 417.5735
- Rent YoY
- —
- Metro
- Providence-Warwick, RI-MA
- State GDP YoY
- ▲ 2.28%
- F500 in state
- 38
Industry mix (Fortune 500 HQ in MA)
| Industry | F500 HQs | Revenue |
|---|---|---|
| Technology | 3 | $17B |
|
||
| Insurance | 2 | $84B |
|
||
| Retail | 2 | $76B |
|
||
| Life Sciences | 1 | $43B |
|
||
| Energy Technology | 1 | $31B |
|
||
| Aerospace / Defense | 1 | $18B |
|
||
Price history
+161.5% since first listed21 events — show timeline
- 2026-06-09 Listed $624,999 MLS PIN
- 2021-01-21 Sold (MLS) $300,000 MLS PIN
- 2020-12-02 Pending — MLS PIN
- 2020-11-17 Listed $289,900 MLS PIN
- 2019-04-10 Sold (MLS) $180,000 MLS PIN
- 2019-02-06 Pending — MLS PIN
- 2019-01-22 Price Changed $189,900 MLS PIN
- 2018-12-31 Price Changed $194,900 MLS PIN
- 2018-12-19 Relisted — MLS PIN
- 2018-12-11 Pending — MLS PIN
- 2018-12-04 Price Changed $199,900 MLS PIN
- 2018-11-19 Price Changed $204,900 MLS PIN
- 2018-10-23 Price Changed $209,900 MLS PIN
- 2018-09-26 Price Changed $219,900 MLS PIN
- 2018-09-20 Price Changed $224,000 MLS PIN
- 2018-08-15 Listed $229,000 MLS PIN
- 2005-10-28 Sold (MLS) $212,500 MLS PIN
- 2005-10-26 Sold (Public Records) $217,500 Public Records
- 2005-10-26 Sold (Public Records) $217,500 Public Records
- 2005-08-05 Listing Removed — MLS PIN
- 2005-06-09 Listed $239,000 MLS PIN
Property tax history
+2.8%/yrLatest (2023): $4,044 · +11.6% YoY. Source: county tax records.
Cash-flow waterfall
monthlySold comps — $/sqft
last 12 mo · ≤1 miLoading sold comps…