None
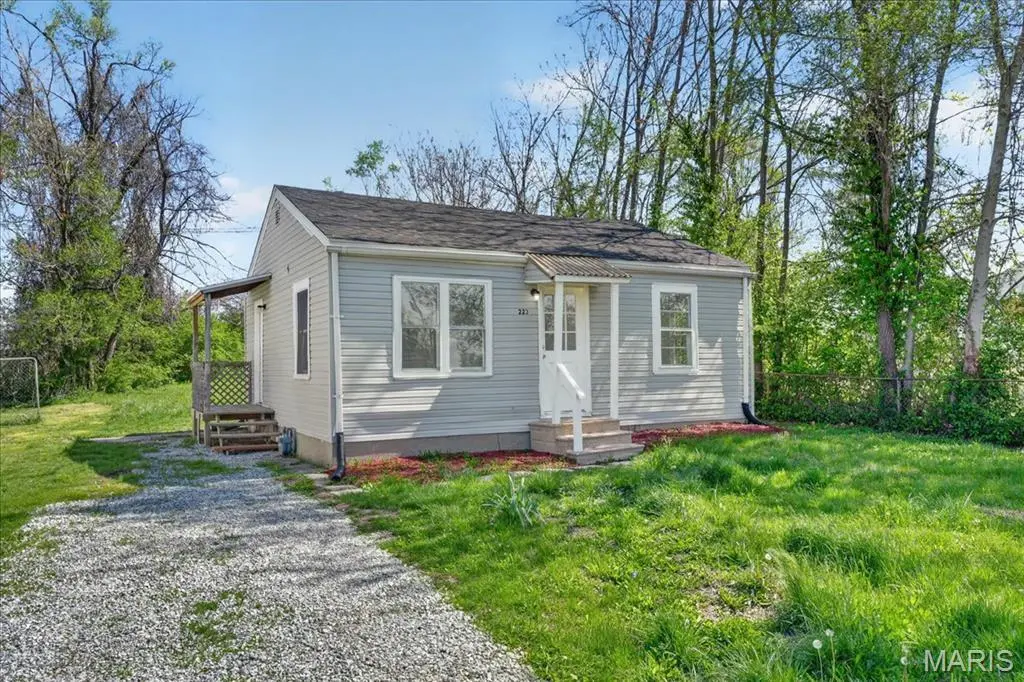
Cahokia Heights, IL 62206
$65,000C
2 bd · 2.0 ba ·
624 sqft ·
Built 1951
· SingleFamily
· Active
· 29 DOM
Cashflow @ list (25.0% down · 7.5%)
Estimated rent
$1,075/mo
Mortgage (P&I)
−$341
Tax + insurance
−$105
HOA
−$0
Vac / Maint / Mgmt
−$226
Net cashflow
$403/mo
Annual
$4,836/yr
Cap rate
13.73%
Cash-on-cash
26.57%
DSCR
2.18
1% rule
1.65%
Cash to close
$18,200
Investor read
- This is a 2-bed/2.0-bath single-family listed at $65k.
- At list price, monthly cash flow is $403 ($5k/yr) — positive.
- The deal already cash-flows at list — no discount required.
- Meets the 1% rule at list price ($1k rent vs $65k).
- It's been on market 29 days — a 2% lower offer ($64k) is reasonable based on typical stale-listing flexibility.
- Recommended offer: $64k (1.5% below list) — sets the bar for market timing.
- Local home prices are declining (-3.0%/yr); year-one equity from $449 of loan paydown is wiped out by about $2k of value loss. Plan a longer hold.
- Location reads: area grade C — affects rentability + tenant quality, not the cash-flow math above.
- Cahokia CUSD 187 (suburban): math 3% / reading 5% proficiency, ranked #864 of 919 in IL (top 94%) — low school quality limits family demand, transient renter base, plan for 1-2y turnover; 85% free/reduced lunch — lower-income household profile, screen leases tightly.
- Watch-outs: built in 1951 — expect roof / HVAC / electrical / plumbing capex.
- Market conditions: 153 active listings in the ZIP; 4 comparable units currently listed for rent nearby; rentals lingering (median 44d on market — plan ~5-8 weeks vacancy on turnover, expect pricing pressure); 50% of comp listings sitting > 30 days — soft ceiling on asking rent; lower-income renter base — watch delinquency; 783 units permitted in St. Clair County in 2024 (378 in 5+ unit buildings).
- St. Clair County population projected at -23% by 2050 — secular population decline; favor cash flow + early exit over multi-decade hold.
- 4 sale attempts since 2y ago with the ask held roughly flat each time — persistent listings suggest the price (not the market) is what's stuck; bring a comps-based counter.
- Current owner paid $5k; list at $65k implies a 1200% gain — meaningful room to come down on a strong offer.
- At projected returns (-3.0% appreciation + 3.0% rent growth), your $18k cash investment doubles in ~5 years — after that, you're playing with house money.
- Climate carrying-cost: extreme-heat days projected 7→20/yr by 2055 (HVAC capex compounding) — expect insurance premiums to compound above CPI over the hold.
- This rent runs 38% of the median local income ($34k/yr) — at the standard rent-burdened threshold; future hikes will face affordability resistance.
Questions for listing agent
- Built in 1951 — when were the roof, HVAC, electrical panel, plumbing, and water heater last replaced?
- Is there a deadline driving the sale (1031 exchange, divorce, estate, relocation)? That informs how much negotiation room exists.
- What's the average days-on-market for RENTAL listings here right now (not sales)? A rising rental-DOM trend means longer vacancies and softer asking-rent achievability than the comps imply.
- What's the recent tenant-quality profile in this submarket — average credit score on applications, eviction rate, late-payment / NSF rate, and stable-employment percentage? A property-management company in the area should have these aggregated.
- How much new for-sale + rental construction is in the pipeline within 1–3 miles? Heavy new supply typically softens prices + rents 12–24 months out; constrained supply supports both.
CashFlowRE · CFR-9FRM7M00G935RY
· Data 1 week ago
cashflowre.app · 2026-05-29