None · Cahokia Heights, IL
Flood risk 1/10 · Minimal
- FEMA flood zone
- X (shaded)
- Chance of flooding over 30 yrs
- 0.0%
- Est. flood insurance / yr
- $507 – $1,088
Fire risk 1/10 · Minimal
- Est. fire insurance / yr
- $804 – $1,492
Heat risk 5/10 · Moderate
- Hot days now (above 108°F)
- 7 days/yr
- Hot days in 30 yrs
- 20 days/yr
Wind risk 2/10 · Minimal
- Chance of severe wind over 30 yrs
- 1.0%
Air-quality risk 3/10 · Minor
- Unhealthy air days now
- 3 days/yr
- Unhealthy air days in 30 yrs
- 4 days/yr
Risk factors via First Street. Map © Google.
Why this score? — see what drove the C grade
The composite is a weighted blend of 9 inputs, each scored 0–100. Each bar is that input's sub-score; the figure is the points it added to the 100-point composite (weight × sub-score).
- Cash flow +30.0/30.0
- 1% rule +10.0/10.0
- DSCR +10.0/10.0
- Rent growth +2.5/5.0
- Livability +2.5/5.0
- Condition / age +2.5/5.0
- Schools +0.6/10.0
- ARV discount +0.0/15.0
- Appreciation +0.0/10.0
$65,000
🖨 Deal sheet 📄 Offer letter ✓ Due diligence
Listing remarks
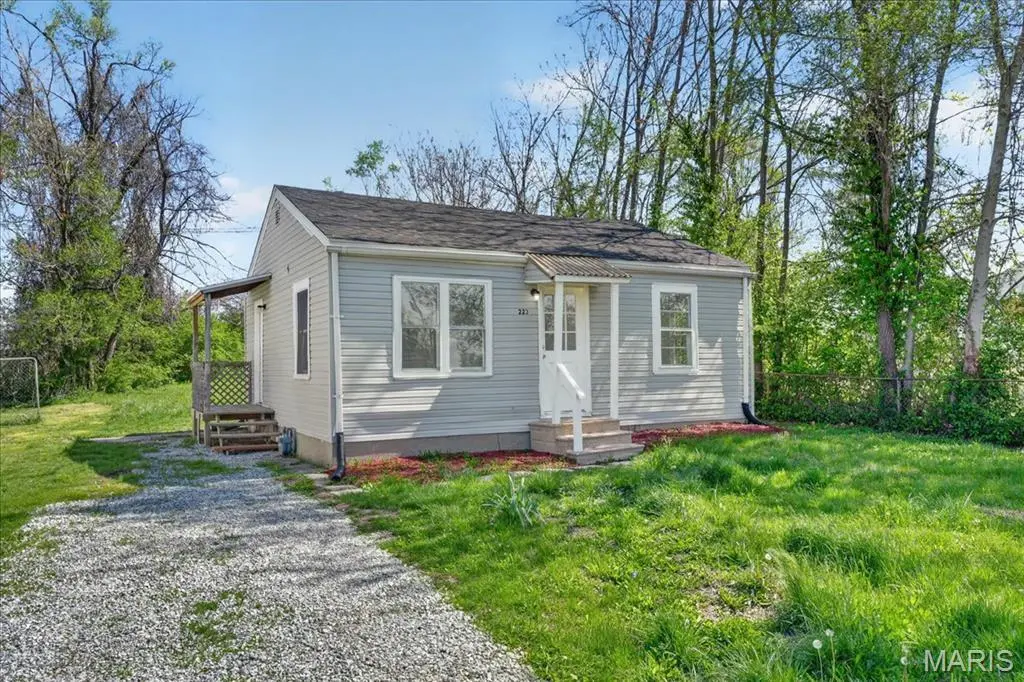
Discover a timeless single-family residence at 223 Nadine ST, Cahokia IL 62206, built in 1951, offering a unique opportunity to embrace a vibrant lifestyle in a home with enduring character. This thoughtfully crafted property invites you to envision your future within its charming walls. To truly appreciate the possibilities this property offers, schedule your private viewing today. This property has been recently renovated and is a blank slate ready for someone's creative hands to make it a home for themselves or someone else.
Key facts
- 6,969 sq ft lot
- Built 1951
- Listed 28 days
Property features AI
Finance
- Other: Living area reported from public records
- Financial info: Lease not considered; No second mortgage indicated
- HOA & community: No community features listed
Exterior
- Parking: Asphalt parking surface
- Security: Carbon monoxide detector(s); Fire alarm
- Utilities: Public water; Ameren electric; Public sewer
- Home design: Single family residence; One story; House; Private ownership; Property listed as fixer and updated/remodeled
- Construction: Vinyl siding; Shingle roof; Slab foundation; Built year from public records
- Exterior features: Back yard; Awning(s) on porch/patio; Panel door(s)
Interior
- Kitchen: No appliances listed
- Bedrooms: 2 bedrooms (both on the main level)
- Flooring: Vinyl flooring
- Bathrooms: 1 full bathroom (on the main level)
- Heating & cooling: Forced air heating; Central air conditioning
- Interior features: Kitchen/dining room combo; Accessible central living area; Carbon monoxide detector(s); Fire alarm
- Laundry & utility: No laundry facilities
Neighborhood map
What this means for you Summary
Snapshot
- This is a 2-bed/2.0-bath single-family listed at $65k.
Deal economics
- At list price, monthly cash flow is $403 ($5k/yr) — positive.
- The deal already cash-flows at list — no discount required.
- Meets the 1% rule at list price ($1k rent vs $65k).
- Recommended offer: $64k (1.5% below list) — sets the bar for market timing.
Location & tenants
- Location reads: area grade C — affects rentability + tenant quality, not the cash-flow math above.
- Cahokia CUSD 187 (suburban): math 3% / reading 5% proficiency, ranked #864 of 919 in IL (top 94%) — low school quality limits family demand, transient renter base, plan for 1-2y turnover; 85% free/reduced lunch — lower-income household profile, screen leases tightly.
- Market conditions: 153 active listings in the ZIP; 4 comparable units currently listed for rent nearby; rentals lingering (median 44d on market — plan ~5-8 weeks vacancy on turnover, expect pricing pressure); 50% of comp listings sitting > 30 days — soft ceiling on asking rent; lower-income renter base — watch delinquency; 783 units permitted in St. Clair County in 2024 (378 in 5+ unit buildings).
- This rent runs 38% of the median local income ($34k/yr) — at the standard rent-burdened threshold; future hikes will face affordability resistance.
Forward outlook
- Local home prices are declining (-3.0%/yr); year-one equity from $449 of loan paydown is wiped out by about $2k of value loss. Plan a longer hold.
- St. Clair County population projected at -23% by 2050 — secular population decline; favor cash flow + early exit over multi-decade hold.
- At projected returns (-3.0% appreciation + 3.0% rent growth), your $18k cash investment doubles in ~5 years — after that, you're playing with house money.
Negotiation context
- It's been on market 29 days — a 2% lower offer ($64k) is reasonable based on typical stale-listing flexibility.
- 4 sale attempts since 2y ago with the ask held roughly flat each time — persistent listings suggest the price (not the market) is what's stuck; bring a comps-based counter.
- Current owner paid $5k; list at $65k implies a 1200% gain — meaningful room to come down on a strong offer.
Risks & watch-outs
- Watch-outs: built in 1951 — expect roof / HVAC / electrical / plumbing capex.
- Climate carrying-cost: extreme-heat days projected 7→20/yr by 2055 (HVAC capex compounding) — expect insurance premiums to compound above CPI over the hold.
Questions for the listing agent
- Built in 1951 — when were the roof, HVAC, electrical panel, plumbing, and water heater last replaced?
- Is there a deadline driving the sale (1031 exchange, divorce, estate, relocation)? That informs how much negotiation room exists.
- What's the average days-on-market for RENTAL listings here right now (not sales)? A rising rental-DOM trend means longer vacancies and softer asking-rent achievability than the comps imply.
- What's the recent tenant-quality profile in this submarket — average credit score on applications, eviction rate, late-payment / NSF rate, and stable-employment percentage? A property-management company in the area should have these aggregated.
- How much new for-sale + rental construction is in the pipeline within 1–3 miles? Heavy new supply typically softens prices + rents 12–24 months out; constrained supply supports both.
Investment metrics
- 1% rule
- 1.65% ✓
- Cap rate
- 13.73%
- Cash-on-cash
- 26.57%
- DSCR
- 2.18
- GRM
- 5.0
CMA / ARV
- ARV (median comp)
- $53,439
- List price
- $65,000
- Delta
- 21.63%
- Verdict
- OVERPRICED
- Comps
- 15 within 1.0 mi
Show comp detail 5 sales within ~0.75 mi
| Address | Dist | Beds/Ba | Sqft | Sold | Price | $/sf | Match |
|---|---|---|---|---|---|---|---|
| 227 Nadine St | 0.02mi | 2/1.0 | 624 (0%) | 0mo | $100,000 | $160 | 95 |
| 211 Judith Ln | 0.08mi | 3/1.0 (+1) | 672 (+8%) | 1mo | $60,000 | $89 | 74 |
| 208 Nadine St | 0.09mi | 2/1.0 | 680 (+9%) | 8mo | $100,000 | $147 | 70 |
| 207 Edwards St | 0.31mi | 2/1.0 | 672 (+8%) | 2mo | $100,000 | $149 | 68 |
| 457 Godin Ave | 0.60mi | 2/1.0 | 608 (-3%) | 16mo | $95,000 | $156 | 51 |
Match score weights: distance 35% · size 25% · config 20% · recency 20%. Top-matched comps best support the ARV.
Projected returns pro-forma
-3.0% appreciation · 3.0% rent growth · sell at horizon
- IRR
- 20.4%
- Equity multiple
- 1.83×
- Total profit
- $15,151
- Equity at exit
- $9,692
- IRR
- 28.6%
- Equity multiple
- 3.54×
- Total profit
- $46,305
- Equity at exit
- $5,620
Cash invested: $18,200 (down + closing). Projections, not guarantees.
Landlord ↔ Tenant lean methodology
- Overall (STATE)
- 43 Moderately Tenant-Leaning
- State Illinois
- 43 Moderately Tenant-Leaning · D+7
- County
- — inherits STATE
- City
- — inherits STATE
ZIP-level market 62206
- Home prices YoY
- -20.2%
- Active inventory
- 153
- Price-to-rent
- 5.0×
Monthly cashflow live
- Estimated rent
- $1,075 medium interval (Pro) →
- Mortgage (P&I)
- −$341
- Tax from tax record
- −$78 /mo · $936/yr
- Insurance
- −$27
- HOA
- −$0
- Vacancy / Maint / Mgmt
- −$226
- Net cashflow
- $403
Break-even live
UW: 25.0% down · 7.5% · 30yr · 1.5% tax · 5.0% vac · 8.0% maint · 8.0% mgmt
Financing live
Cash to close
- Down payment
- $16,250
- Closing costs
- $1,950
- Reserves months
- —
- Total cash needed
- —
Loan-product check · same deal, 3 products live
Conventional
25% down · 7.5% · 30yr
- Down + closing
- —
- Monthly P&I
- —
- Monthly cashflow
- —
- DSCR
- —
- Eligible?
- —
Personal DTI + credit; lowest rate.
DSCR
20% down · 8.5% · 30yr
- Down + closing
- —
- Monthly P&I
- —
- Monthly cashflow
- —
- DSCR
- —
- Eligible?
- —
No personal income docs; deal must DSCR.
Hard money
10% down · 12.0% · 12mo
- Down + closing
- —
- Monthly P&I
- —
- Monthly cashflow
- —
- DSCR
- —
- Eligible?
- —
Short-term bridge; refi at stabilization.
Rent comps 4 comps
| Address | Beds | Baths | Sqft | Rent | $/sqft | DOM | Units | Dist |
|---|---|---|---|---|---|---|---|---|
| 211 Judith Ln East Saint Louis, IL | 2.0 | 1.0 | 672 | $995 | $1.48 | 4d | 1 | 0.08mi |
| 1002 Upper Cahokia Rd East Saint Louis, IL | 3.0 | 1.0 | 720 | $860 | $1.19 | 14d | 1 | 0.51mi |
| 115 Jerome Ln Unit 3 Sauget, IL | 1.0 | 1.0 | 700 | $700 | $1.00 | 43d | 1 | 0.52mi |
| 1716 # E Unit Loretta Ave unit East St Louis, IL | 2.0 | 1.0 | 720 | $1,000 | $1.39 | 43d | 1 | 1.49mi |
Listing history 18 events
-
2026-06-09days on market $65,000 Active 29 DOM
-
2026-06-08days on market $65,000 Active 28 DOM
-
2026-06-07days on market $65,000 Active 27 DOM
-
2026-06-05days on market $65,000 Active 24 DOM
-
2026-06-03days on market $65,000 Active 23 DOM
-
2026-06-02days on market $65,000 Active 22 DOM
-
2026-06-01days on market $65,000 Active 21 DOM
-
2026-05-31days on market $65,000 Active 20 DOM
-
2026-05-12$65,000 Active 534-char remark
-
2026-05-08historical $65,000 534-char remark
-
2024-11-22status Active
-
2024-11-13historical
-
2024-09-13status Active
-
2024-08-23historical
-
2024-08-15$72,333 Active
-
2024-08-13historical
-
2017-08-21price $21,500
-
1994-07-07soldstatus $5,000
ⓘ Source: listings_history table (triggers on properties + properties_extension) + one-shot
backfill from property_details.listing_events for pre-trigger history.
Tax reassessment forecast IL · Partial reset (capped growth)
- Current annual tax
- $936 · $78/mo
- Projected year-2 tax
- $1,206 · $100/mo
- Expected delta
- +$270/yr (+$22/mo · 28.8%)
ⓘ Screening estimate from a state-policy table — verify with the county assessor before closing.
Climate risk First Street
- Flood 1/10 Low FEMA zone X (shaded) · 0% chance over 30 yrs
- Wildfire 1/10 Low
- Heat 5/10 Major 7 d/yr ≥108°F today · 20 d/yr by 30 yrs out
- Wind 2/10 Low 100% chance of damaging wind over 30 yrs
- Air quality 3/10 Moderate 3 unhealthy d/yr today · 4 by 30 yrs out
Nearby sold comps map
Loading sold comps map…
Walkable amenities ~0.75 mi
Loading nearby amenities…
Taxation est. · year 1
- Rental income
- $12,896
- − Mortgage interest
- −$3,641
- − Property taxes
- −$936
- − Insurance
- −$325
- − Repairs & maintenance
- −$1,032
- − Management
- −$1,032
- − Depreciation
- −$1,891
- Taxable income
- $4,040
- Est. tax owed @ 24.0%
- −$970
- After-tax cash flow
- $3,867/yr
For passive investors: Depreciation is non-cash, so a rental often shows a tax loss while cash-flowing — sheltering income. Rental losses are passive: they offset passive income freely, and up to $25,000/yr can offset ordinary (W-2) income if you actively participate and your MAGI is under $100k (phasing out to $0 by $150k); unused losses carry forward. On sale, claimed depreciation is recaptured at up to 25%, and gains may owe capital-gains tax (a 1031 exchange can defer both). Figures are a year-1 estimate at your 24.0% rate — not tax advice; consult a CPA.
Schools (NCES district)
- District
- Cahokia CUSD 187
- NCES district ID
- 1708040
- Math proficiency
- 3% ▼ -2.00%
- Reading proficiency
- 5% ▬ 0.00%
- Median HH income
- $28,028
- Composite
- 6.44/100
- National rank
- #14827
- State rank
- #864 of 919 in IL
Livability — Cahokia Heights
No livability data for this city. (Only ~50 U.S. cities are tracked.)
Census & demographics
- Census place
- Cahokia Heights, IL
- County
- Saint Clair County · 169,691 people
- Metro
- St. Louis, MO-IL
- Population (ZIP)
- 12,959
- Household income
- $33,838
- Rent vs Own
- Severe rent burden
- 729.0
Population outlook (St. Clair County) Hauer SSP2
- Today (2025)
- 250,366 people
- By 2030
- 240,511 · -3.9%
- By 2040
- 217,391 · -13.2%
- By 2050
- 192,699 · -23.0%
- By 2075
- 140,637 · -43.8%
- By 2100
- 100,499 · -59.9%
Race, ethnicity, and origin ACS 2023
- Neighborhood character
- Diverse neighborhood (Simpson 0.56)
- Race & ethnicity
- Black 59% White 29% Two or more races 6% Hispanic / Latino 3% Asian 2%
- Common ancestry
- Romanian 2% Lithuanian 1% Iranian 1%
- Foreign-born
- 2% · China
- Languages at home
- 95% English-only · Spanish 3% Other Indo-European 1% Chinese 1%
Political lean MEDSL · St. Clair
- 2024 margin
- Lean D (+7.9) · D 53.0% · R 45.1% · Other 1.8%
- 2008→2024 swing
- -14.6pp toward R · 2008: 22.4pp · 2024: 7.9pp
- All cycles
- 2024: D+7.9 2020: D+8.7 2016: D+5.6 2012: D+14.5 2008: D+22.4
Not yet ingested
- Civics
- —
Market trends
- HPI YoY
- ▼ -33.26%
- Current HPI
- 131.5144
- Rent YoY
- —
- Metro
- St. Louis, MO-IL
- State GDP YoY
- ▲ 1.59%
- F500 in state
- 60
Industry mix (Fortune 500 HQ in IL)
| Industry | F500 HQs | Revenue |
|---|---|---|
| Insurance | 4 | $201B |
|
||
| Consumer Goods | 4 | $87B |
|
||
| Industrial Machinery | 3 | $64B |
|
||
| Healthcare | 2 | $55B |
|
||
| Retail / Pharmacy | 1 | $148B |
|
||
| Agriculture / Food | 1 | $86B |
|
||
Price history
+1200.0% since first listed10 events — show timeline
- 2026-05-12 Listed $65,000 MARIS as Distributed by MLS Grid
- 2026-05-08 Coming Soon — MARIS as Distributed by MLS Grid
- 2024-11-22 Relisted — MARIS as Distributed by MLS Grid
- 2024-11-13 Delisted — MARIS as Distributed by MLS Grid
- 2024-09-13 Relisted — MARIS as Distributed by MLS Grid
- 2024-08-23 Delisted — MARIS as Distributed by MLS Grid
- 2024-08-15 Listed $72,333 MARIS as Distributed by MLS Grid
- 2024-08-13 Coming Soon — MARIS as Distributed by MLS Grid
- 2017-08-21 Price Changed $21,500 MARIS as Distributed by MLS Grid
- 1994-07-07 Sold (Public Records) $5,000 Public Records
Property tax history
-1.5%/yrLatest (2023): $936 · +9.3% YoY. Source: county tax records.
Cash-flow waterfall
monthlySold comps — $/sqft
last 12 mo · ≤1 miLoading sold comps…