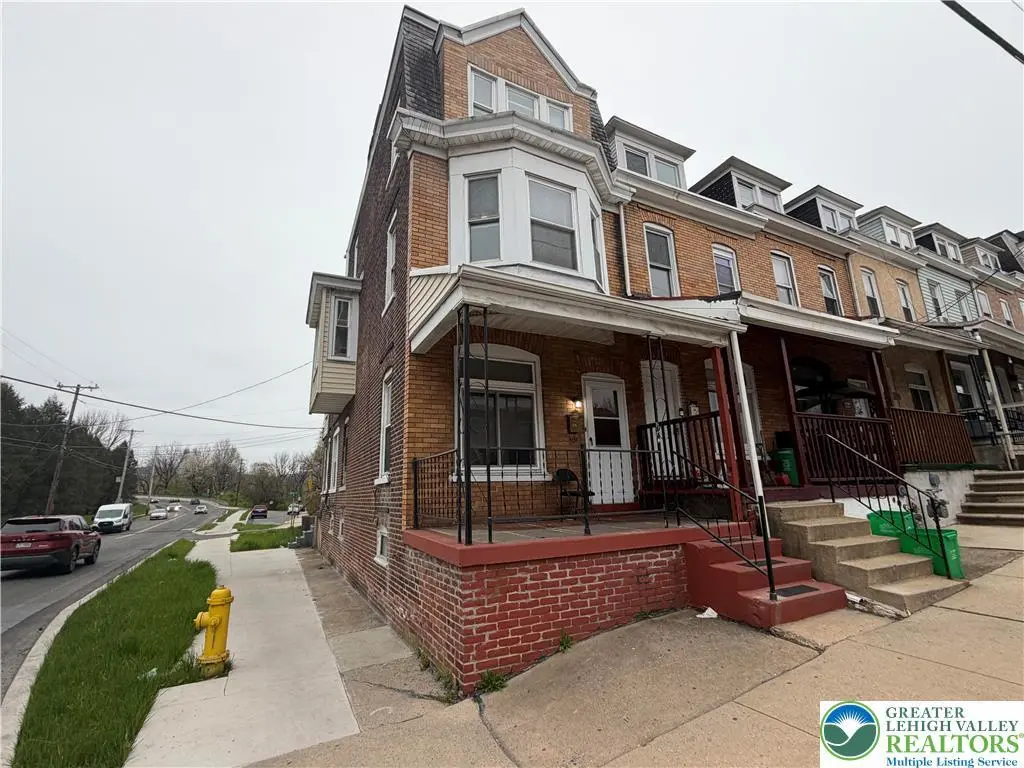
502 W Wyoming St
Allentown, PA 18103
$234,900C-
4 bd · 1.5 ba ·
1,657 sqft ·
Built 1914
· SingleFamily
· Pending
· 22 DOM
Cashflow @ list (25.0% down · 7.5%)
Estimated rent
$2,196/mo
Mortgage (P&I)
−$1,232
Tax + insurance
−$327
HOA
−$0
Vac / Maint / Mgmt
−$461
Net cashflow
$176/mo
Annual
$2,110/yr
Cap rate
7.19%
Cash-on-cash
3.21%
DSCR
1.14
1% rule
0.93%
Cash to close
$65,772
Investor read
- This is a 4-bed/1.5-bath single-family listed at $235k.
- At list price, monthly cash flow is $176 ($2k/yr) — positive.
- The deal already cash-flows at list — no discount required.
- To meet the 1% rule (rent ≥ 1% of price), the offer needs to be $220k (6.5% below list).
- It's been on market 22 days — a 2% lower offer ($231k) is reasonable based on typical stale-listing flexibility.
- Recommended offer: $220k (6.5% below list) — sets the bar for 1% rule.
- Local home prices are declining (-3.0%/yr); year-one equity from $2k of loan paydown is wiped out by about $7k of value loss. Plan a longer hold.
- Location reads 81/100 on livability (#171 in PA, #1,440 nationally) — a professional / high-income tenant draw. Strengths: commute A+, cost of living A+, housing A+; Watch: schools D+, employment D.
- Allentown City SD (urban): math 10% / reading 20% proficiency, ranked #513 of 539 in PA (top 95%) — low school quality limits family demand, transient renter base, plan for 1-2y turnover; 73% free/reduced lunch — lower-income household profile, screen leases tightly.
- Watch-outs: built in 1914 — expect roof / HVAC / electrical / plumbing capex.
- Market conditions: Rents rising fast (+7.0%/yr); 161 active listings in the ZIP; 39 comparable units currently listed for rent nearby; rentals at typical pace (median 21d on market — plan ~3-4 weeks tenant-placement turnaround); 765 units permitted in Lehigh County in 2024 (286 in 5+ unit buildings).
- Lehigh County population projected at +21% by 2050 — long-run rental-demand tailwind backs the buy-and-hold thesis.
- 5 sale attempts since 25y ago with the ask held roughly flat each time — persistent listings suggest the price (not the market) is what's stuck; bring a comps-based counter.
- Climate carrying-cost: extreme-heat days projected 7→15/yr by 2055 (HVAC capex compounding) — expect insurance premiums to compound above CPI over the hold.
- Cap rate 7.2% vs local median 5.3% in Allentown — top-decile yield for the area; either an underpriced asset or a hidden risk that comps aren't pricing in. Stress-test before assuming the spread holds.
- This rent runs 36% of the median local income ($73k/yr) — at the standard rent-burdened threshold; future hikes will face affordability resistance.
Questions for listing agent
- Built in 1914 — when were the roof, HVAC, electrical panel, plumbing, and water heater last replaced?
- Is there a deadline driving the sale (1031 exchange, divorce, estate, relocation)? That informs how much negotiation room exists.
- Schools are D-rated, which usually means shorter tenancies and higher turnover. Who's the typical renter profile here, and what's been the actual vacancy rate?
- What's the average days-on-market for RENTAL listings here right now (not sales)? A rising rental-DOM trend means longer vacancies and softer asking-rent achievability than the comps imply.
- What's the recent tenant-quality profile in this submarket — average credit score on applications, eviction rate, late-payment / NSF rate, and stable-employment percentage? A property-management company in the area should have these aggregated.
- How much new for-sale + rental construction is in the pipeline within 1–3 miles? Heavy new supply typically softens prices + rents 12–24 months out; constrained supply supports both.
CashFlowRE · CFR-9FWR2JDKCHTN3Z
· Data 3 weeks ago
cashflowre.app · 2026-05-29