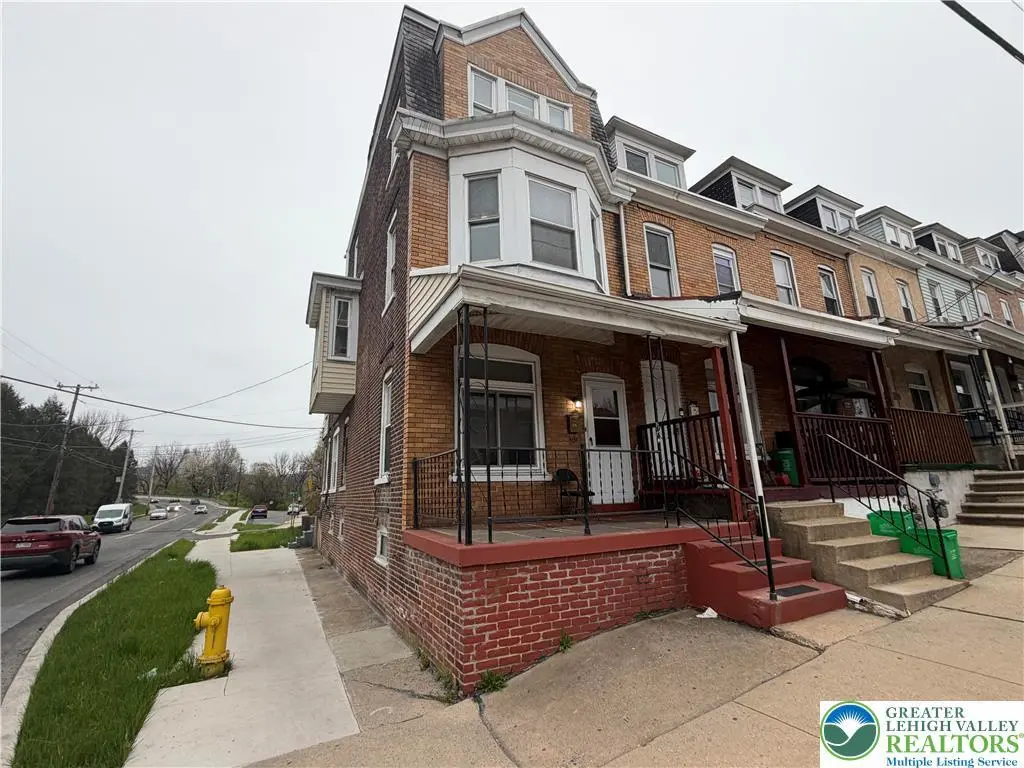
502 W Wyoming St · Allentown, PA
Flood risk 1/10 · Minimal
- FEMA flood zone
- X (unshaded)
- Chance of flooding over 30 yrs
- 0.0%
- Est. flood insurance / yr
- $473 – $860
Fire risk 3/10 · Minor
- Est. fire insurance / yr
- $511 – $949
Heat risk 5/10 · Moderate
- Hot days now (above 99°F)
- 7 days/yr
- Hot days in 30 yrs
- 15 days/yr
Wind risk 4/10 · Minor
- Chance of severe wind over 30 yrs
- 16.0%
Air-quality risk 3/10 · Minor
- Unhealthy air days now
- 3 days/yr
- Unhealthy air days in 30 yrs
- 4 days/yr
Risk factors via First Street. Map © Google.
Why this score? — see what drove the C- grade
The composite is a weighted blend of 9 inputs, each scored 0–100. Each bar is that input's sub-score; the figure is the points it added to the 100-point composite (weight × sub-score).
- Cash flow +17.4/30.0
- ARV discount +15.0/15.0
- DSCR +5.4/10.0
- 1% rule +4.3/10.0
- Rent growth +4.3/5.0
- Livability +4.0/5.0
- Condition / age +2.5/5.0
- Schools +1.2/10.0
- Appreciation +0.0/10.0
$234,900
🖨 Deal sheet 📄 Offer letter ✓ Due diligence
Listing remarks MLS
This remodeled end-unit row home, located right across from Good Shepherd Hospital, offers 5 bedrooms and 1.5 baths. Enjoy a covered porch, fenced yard, and a newly updated kitchen. The living and dining areas feature a combined layout, complemented by a remodeled full bath, fresh paint, and new carpet. With gas heat, hot water, replacement windows, and a basement laundry room with washer and dryer, it’s move-in ready!
Key facts
- Covered porch
- Fenced yard
- Remodeled full bath
Tags
Neighborhood map
What this means for you Summary
Snapshot
- This is a 4-bed/1.5-bath single-family listed at $235k.
Deal economics
- At list price, monthly cash flow is $176 ($2k/yr) — positive.
- The deal already cash-flows at list — no discount required.
- To meet the 1% rule (rent ≥ 1% of price), the offer needs to be $220k (6.5% below list).
- Recommended offer: $220k (6.5% below list) — sets the bar for 1% rule.
- Cap rate 7.2% vs local median 5.3% in Allentown — top-decile yield for the area; either an underpriced asset or a hidden risk that comps aren't pricing in. Stress-test before assuming the spread holds.
Location & tenants
- Location reads 81/100 on livability (#171 in PA, #1,440 nationally) — a professional / high-income tenant draw. Strengths: commute A+, cost of living A+, housing A+; Watch: schools D+, employment D.
- Allentown City SD (urban): math 10% / reading 20% proficiency, ranked #513 of 539 in PA (top 95%) — low school quality limits family demand, transient renter base, plan for 1-2y turnover; 73% free/reduced lunch — lower-income household profile, screen leases tightly.
- Market conditions: Rents rising fast (+7.0%/yr); 161 active listings in the ZIP; 39 comparable units currently listed for rent nearby; rentals at typical pace (median 21d on market — plan ~3-4 weeks tenant-placement turnaround); 765 units permitted in Lehigh County in 2024 (286 in 5+ unit buildings).
- This rent runs 36% of the median local income ($73k/yr) — at the standard rent-burdened threshold; future hikes will face affordability resistance.
Forward outlook
- Local home prices are declining (-3.0%/yr); year-one equity from $2k of loan paydown is wiped out by about $7k of value loss. Plan a longer hold.
- Lehigh County population projected at +21% by 2050 — long-run rental-demand tailwind backs the buy-and-hold thesis.
Negotiation context
- It's been on market 22 days — a 2% lower offer ($231k) is reasonable based on typical stale-listing flexibility.
- 5 sale attempts since 25y ago with the ask held roughly flat each time — persistent listings suggest the price (not the market) is what's stuck; bring a comps-based counter.
Risks & watch-outs
- Watch-outs: built in 1914 — expect roof / HVAC / electrical / plumbing capex.
- Climate carrying-cost: extreme-heat days projected 7→15/yr by 2055 (HVAC capex compounding) — expect insurance premiums to compound above CPI over the hold.
Questions for the listing agent
- Built in 1914 — when were the roof, HVAC, electrical panel, plumbing, and water heater last replaced?
- Is there a deadline driving the sale (1031 exchange, divorce, estate, relocation)? That informs how much negotiation room exists.
- Schools are D-rated, which usually means shorter tenancies and higher turnover. Who's the typical renter profile here, and what's been the actual vacancy rate?
- What's the average days-on-market for RENTAL listings here right now (not sales)? A rising rental-DOM trend means longer vacancies and softer asking-rent achievability than the comps imply.
- What's the recent tenant-quality profile in this submarket — average credit score on applications, eviction rate, late-payment / NSF rate, and stable-employment percentage? A property-management company in the area should have these aggregated.
- How much new for-sale + rental construction is in the pipeline within 1–3 miles? Heavy new supply typically softens prices + rents 12–24 months out; constrained supply supports both.
Investment metrics
- 1% rule
- 0.93% ✗
- Cap rate
- 7.19%
- Cash-on-cash
- 3.21%
- DSCR
- 1.14
- GRM
- 8.9
CMA / ARV
- ARV (median comp)
- $305,249
- List price
- $234,900
- Delta
- -23.05%
- Verdict
- UNDERPRICED
- Comps
- 20 within 1.0 mi
Show comp detail 6 sales within ~0.75 mi
| Address | Dist | Beds/Ba | Sqft | Sold | Price | $/sf | Match |
|---|---|---|---|---|---|---|---|
| 1004 S Meadow St | 0.21mi | 3/1.0 (-1) | 1,591 (-4%) | 12mo | $289,900 | $182 | 66 |
| Carldon St Unit (Also 601 and 605) | 0.47mi | 4/1.5 | 1,491 (-10%) | 0mo | $280,000 | $188 | 61 |
| 1030 Colorado St | 0.66mi | 3/1.5 (-1) | 1,614 (-3%) | 1mo | $330,000 | $204 | 59 |
| 1123 S 8th St | 0.32mi | 3/2.0 (-1) | 1,664 (+0%) | 24mo | $329,900 | $198 | 58 |
| 323 Chapel Ave | 0.42mi | 3/1.5 (-1) | 1,459 (-12%) | 24mo | $315,000 | $216 | 36 |
| 1610 S Albert St | 0.75mi | 3/1.5 (-1) | 1,472 (-11%) | 16mo | $325,000 | $221 | 28 |
Match score weights: distance 35% · size 25% · config 20% · recency 20%. Top-matched comps best support the ARV.
Projected returns pro-forma
-3.0% appreciation · 7.05% rent growth · sell at horizon
- IRR
- -6.9%
- Equity multiple
- 0.73×
- Total profit
- $-17,560
- Equity at exit
- $35,024
- IRR
- 7.0%
- Equity multiple
- 1.62×
- Total profit
- $40,642
- Equity at exit
- $20,310
Cash invested: $65,772 (down + closing). Projections, not guarantees.
Landlord ↔ Tenant lean methodology
- Overall (STATE)
- 62 Landlord-Friendly
- State Pennsylvania
- 62 Landlord-Friendly · EVEN
- County
- — inherits STATE
- City
- — inherits STATE
ZIP-level market 18103
- Rents YoY
- 7.0%
- Active inventory
- 161
- Price-to-rent
- 8.9×
Monthly cashflow live
- Estimated rent
- $2,196 high interval (Pro) →
- Mortgage (P&I)
- −$1,232
- Tax from tax record
- −$229 /mo · $2,747/yr
- Insurance
- −$98
- HOA
- −$0
- Vacancy / Maint / Mgmt
- −$461
- Net cashflow
- $176
Break-even live
UW: 25.0% down · 7.5% · 30yr · 1.5% tax · 5.0% vac · 8.0% maint · 8.0% mgmt
Financing live
Cash to close
- Down payment
- $58,725
- Closing costs
- $7,047
- Reserves months
- —
- Total cash needed
- —
Loan-product check · same deal, 3 products live
Conventional
25% down · 7.5% · 30yr
- Down + closing
- —
- Monthly P&I
- —
- Monthly cashflow
- —
- DSCR
- —
- Eligible?
- —
Personal DTI + credit; lowest rate.
DSCR
20% down · 8.5% · 30yr
- Down + closing
- —
- Monthly P&I
- —
- Monthly cashflow
- —
- DSCR
- —
- Eligible?
- —
No personal income docs; deal must DSCR.
Hard money
10% down · 12.0% · 12mo
- Down + closing
- —
- Monthly P&I
- —
- Monthly cashflow
- —
- DSCR
- —
- Eligible?
- —
Short-term bridge; refi at stabilization.
Rent comps 39 comps
| Address | Beds | Baths | Sqft | Rent | $/sqft | DOM | Units | Dist |
|---|---|---|---|---|---|---|---|---|
| 644 Lehigh St Allentown, PA | 3.0 | 1.0 | 1714 | $2,250 | $1.31 | 43d | 1 | 0.25mi |
| 748 S Hall St Unit 1 Allentown, PA | 3.0 | 1.5 | 1183 | $2,000 | $1.69 | 23d | 1 | 0.29mi |
| 314 Barber St Lot 35 Allentown, PA | 3.0 | 2.5 | 1525 | $2,450 | $1.61 | 18d | 1 | 0.44mi |
| 948 W Maple St Allentown, PA | 4.0 | 1.0 | 1932 | $2,300 | $1.19 | 43d | 1 | 0.91mi |
| 144 S 12th St Allentown, PA | 4.0 | 2.0 | 1242 | $2,000 | $1.61 | 2d | 1 | 1.00mi |
| 519 Vine St Allentown, PA | 3.0 | 1.0 | 1100 | $2,400 | $2.18 | 2d | 1 | 1.03mi |
| 832 Chestnut St Allentown, PA | 3.0 | 1.0 | 1124 | $2,100 | $1.87 | 23d | 1 | 1.03mi |
| 2013 S 6th St Allentown, PA | 3.0 | 1.0 | 1080 | $2,300 | $2.13 | 14d | 1 | 1.04mi |
| 389 W Turner St Allentown, PA | 4.0 | 1.5 | 2144 | $2,400 | $1.12 | 2d | 1 | 1.06mi |
| 626 Oak St Allentown, PA | 3.0 | 1.0 | 1396 | $1,900 | $1.36 | 43d | 1 | 1.08mi |
| 209 N Eighth St Apt 2 Allentown, PA | 3.0 | 1.0 | 1430 | $1,550 | $1.08 | 43d | 1 | 1.09mi |
| 36 S Jefferson St Allentown, PA | 5.0 | 1.5 | 2128 | $2,500 | $1.17 | 14d | 1 | 1.11mi |
| 749 Benton St Allentown, PA | 3.0 | 1.0 | 1152 | $1,950 | $1.69 | 14d | 1 | 1.12mi |
| 111 Ridge Ave Allentown, PA | 4.0 | 1.0 | 1658 | $1,650 | $1.00 | 43d | 1 | 1.12mi |
| 622 W Chew St Unit 2 Allentown, PA | 3.0 | 1.0 | 1161 | $1,600 | $1.38 | 18d | 1 | 1.13mi |
| 2074 Baker Dr Allentown, PA | 3.0 | 1.0 | 1462 | $2,195 | $1.50 | 43d | 1 | 1.13mi |
| 2307 S 5th St Allentown, PA | 3.0 | 1.5 | 1296 | $2,300 | $1.77 | 14d | 1 | 1.15mi |
| 216 S 14th St Allentown, PA | 4.0 | 1.5 | 1640 | $2,300 | $1.40 | 2d | 1 | 1.17mi |
| 605 E Susquehanna St Allentown, PA | 3.0 | 1.0 | 1092 | $2,500 | $2.29 | 14d | 1 | 1.18mi |
| 208 Ridge Ave Allentown, PA | 4.0 | 1.0 | 1396 | $1,700 | $1.22 | 23d | 1 | 1.19mi |
| 208 Ridge Ave Allentown, PA | 4.0 | 1.0 | 1396 | $1,600 | $1.15 | 2d | 1 | 1.19mi |
| 213 Chew St Allentown, PA | 5.0 | 1.0 | 1725 | $2,100 | $1.22 | 43d | 1 | 1.22mi |
| 230 E Fairview St Allentown, PA | 3.0 | 2.0 | 1414 | $2,300 | $1.63 | 23d | 1 | 1.23mi |
| 347 N 7th St Apt 3 Allentown, PA | 3.0 | 1.0 | 1200 | $1,500 | $1.25 | 43d | 1 | 1.23mi |
| 407 N 4th St Allentown, PA | 3.0 | 1.5 | 1321 | $1,550 | $1.17 | 23d | 1 | 1.26mi |
| 41 S Franklin St Allentown, PA | 5.0 | 2.0 | 1897 | $2,500 | $1.32 | 14d | 1 | 1.27mi |
| 828 W Gordon St Allentown, PA | 4.0 | 2.5 | 1628 | $2,250 | $1.38 | 2d | 1 | 1.27mi |
| 132 Chew St Allentown, PA | 3.0 | 1.0 | 1160 | $1,995 | $1.72 | 14d | 1 | 1.28mi |
| 432 N Law St Allentown, PA | 4.0 | 1.0 | 1328 | $1,500 | $1.13 | 14d | 1 | 1.29mi |
| 944 W Gordon St Allentown, PA | 3.0 | 1.5 | 1146 | $1,750 | $1.53 | 23d | 1 | 1.32mi |
| 517 Elliger St Allentown, PA | 3.0 | 1.5 | 1235 | $1,700 | $1.38 | 23d | 1 | 1.38mi |
| 1542 Walnut St Apt 2 Allentown, PA | 4.0 | 1.0 | 1132 | $1,850 | $1.63 | 21d | 1 | 1.38mi |
| 528 N 6th St Allentown, PA | 3.0 | 1.0 | 1934 | $1,800 | $0.93 | 43d | 1 | 1.38mi |
| 1143 Lova Ln Allentown, PA | 3.0 | 2.5 | 1404 | $2,500 | $1.78 | 14d | 1 | 1.40mi |
| 1437 Webster St Allentown, PA | 3.0 | 1.0 | 1080 | $1,475 | $1.37 | 43d | 1 | 1.43mi |
| 395 W Allen St Allentown, PA | 3.0 | 1.0 | 1344 | $1,800 | $1.34 | 23d | 1 | 1.45mi |
| 631 W Allen St Allentown, PA | 5.0 | 1.5 | 1695 | $2,100 | $1.24 | 43d | 1 | 1.45mi |
| 622 Park St Allentown, PA | 5.0 | 1.5 | 1638 | $2,300 | $1.40 | 2d | 1 | 1.48mi |
| 1341 Chew St Allentown, PA | 5.0 | 1.5 | 2139 | $2,500 | $1.17 | 21d | 1 | 1.49mi |
Listing history 17 events
-
2026-05-06status Pending 428-char remark
Show marketing remark (428 chars)
This remodeled end-unit row home, located right across from Good Shepherd Hospital, offers 5 bedrooms and 1.5 baths. Enjoy a covered porch, fenced yard, and a newly updated kitchen. The living and dining areas feature a combined layout, complemented by a remodeled full bath, fresh paint, and new carpet. With gas heat, hot water, replacement windows, and a basement laundry room with washer and dryer, it’s move-in ready!
-
2026-04-30price $234,900 428-char remark
Show marketing remark (428 chars)
This remodeled end-unit row home, located right across from Good Shepherd Hospital, offers 5 bedrooms and 1.5 baths. Enjoy a covered porch, fenced yard, and a newly updated kitchen. The living and dining areas feature a combined layout, complemented by a remodeled full bath, fresh paint, and new carpet. With gas heat, hot water, replacement windows, and a basement laundry room with washer and dryer, it’s move-in ready!
-
2026-04-14$239,900 Active 428-char remark
Show marketing remark (428 chars)
This remodeled end-unit row home, located right across from Good Shepherd Hospital, offers 5 bedrooms and 1.5 baths. Enjoy a covered porch, fenced yard, and a newly updated kitchen. The living and dining areas feature a combined layout, complemented by a remodeled full bath, fresh paint, and new carpet. With gas heat, hot water, replacement windows, and a basement laundry room with washer and dryer, it’s move-in ready!
-
2025-01-02soldstatus $1,800,000
-
2018-09-07soldstatus $66,000 Sold 506-char remark
Show marketing remark (506 chars)
South Allentown 4 bedroom row located directly across the street from Good Shepherd Nursing Home. The exterior features a fenced yard and covered front porch, as well as a maintenance free brick exterior. Parking is plentiful. Inside you will find the home has been freshly painted. The windows are all vinyl replacements. The flooring throughout most the home was covered in floor grade dark walnut. A brand new gas furnace and water heater being installed. Seller to provide clear city inspection report.
-
2018-08-24status Pending 506-char remark
Show marketing remark (506 chars)
South Allentown 4 bedroom row located directly across the street from Good Shepherd Nursing Home. The exterior features a fenced yard and covered front porch, as well as a maintenance free brick exterior. Parking is plentiful. Inside you will find the home has been freshly painted. The windows are all vinyl replacements. The flooring throughout most the home was covered in floor grade dark walnut. A brand new gas furnace and water heater being installed. Seller to provide clear city inspection report.
-
2018-08-20$69,900 Active 506-char remark
Show marketing remark (506 chars)
South Allentown 4 bedroom row located directly across the street from Good Shepherd Nursing Home. The exterior features a fenced yard and covered front porch, as well as a maintenance free brick exterior. Parking is plentiful. Inside you will find the home has been freshly painted. The windows are all vinyl replacements. The flooring throughout most the home was covered in floor grade dark walnut. A brand new gas furnace and water heater being installed. Seller to provide clear city inspection report.
-
2007-09-25soldstatus $100,000
-
2007-09-25soldstatus $100,000
-
2007-06-27$124,900
-
2004-05-10soldstatus $65,000
-
2004-05-04soldstatus $65,000
-
2004-01-24$80,000
-
2001-04-10soldstatus $17,000
-
2001-03-02$17,000
-
1990-08-01soldstatus $64,900
-
1984-01-23soldstatus $25,250
ⓘ Source: listings_history table (triggers on properties + properties_extension) + one-shot
backfill from property_details.listing_events for pre-trigger history.
Tax reassessment forecast PA · Partial reset (capped growth)
- Current annual tax
- $2,747 · $229/mo
- Projected year-2 tax
- $3,229 · $269/mo
- Expected delta
- +$482/yr (+$40/mo · 17.6%)
ⓘ Screening estimate from a state-policy table — verify with the county assessor before closing.
Climate risk First Street
- Flood 1/10 Low FEMA zone X (unshaded) · 0% chance over 30 yrs
- Wildfire 3/10 Moderate
- Heat 5/10 Major 7 d/yr ≥99°F today · 15 d/yr by 30 yrs out
- Wind 4/10 Moderate 16% chance of damaging wind over 30 yrs
- Air quality 3/10 Moderate 3 unhealthy d/yr today · 4 by 30 yrs out
Nearby sold comps map
Loading sold comps map…
Walkable amenities ~0.75 mi
Loading nearby amenities…
Taxation est. · year 1
- Rental income
- $26,346
- − Mortgage interest
- −$13,158
- − Property taxes
- −$2,747
- − Insurance
- −$1,174
- − Repairs & maintenance
- −$2,108
- − Management
- −$2,108
- − Depreciation
- −$6,833
- Taxable loss
- −$1,782
- Est. tax savings @ 24.0%
- +$428
- After-tax cash flow
- $2,538/yr
For passive investors: Depreciation is non-cash, so a rental often shows a tax loss while cash-flowing — sheltering income. Rental losses are passive: they offset passive income freely, and up to $25,000/yr can offset ordinary (W-2) income if you actively participate and your MAGI is under $100k (phasing out to $0 by $150k); unused losses carry forward. On sale, claimed depreciation is recaptured at up to 25%, and gains may owe capital-gains tax (a 1031 exchange can defer both). Figures are a year-1 estimate at your 24.0% rate — not tax advice; consult a CPA.
Schools (NCES district)
- District
- Allentown City SD
- NCES district ID
- 4202280
- Math proficiency
- 10% ▼ -10.00%
- Reading proficiency
- 20% ▼ -15.00%
- Median HH income
- $36,337
- Composite
- 12.43/100
- National rank
- #9630
- State rank
- #513 of 539 in PA
Livability — Allentown
- Score
- 81/100
- State rank
- #171
- US rank
- #1440
Category grades
Schools grade is shown separately in the Schools card above.
Census & demographics
- Census place
- Allentown, PA
- County
- Lehigh County · 333,019 people
- City population
- 172,996
- Metro
- Allentown-Bethlehem-Easton, PA-NJ
- Population (ZIP)
- 48,746
- Household income
- $72,895
- Rent vs Own
- Severe rent burden
- 1792.0
Population outlook (Lehigh County) Hauer SSP2
- Today (2025)
- 392,957 people
- By 2030
- 408,319 · +3.9%
- By 2040
- 440,007 · +12.0%
- By 2050
- 475,940 · +21.1%
- By 2075
- 590,448 · +50.3%
- By 2100
- 690,314 · +75.7%
Race, ethnicity, and origin ACS 2023
- Neighborhood character
- Diverse neighborhood (Simpson 0.63)
- Race & ethnicity
- White 46% Hispanic / Latino 38% Two or more races 15% Black 9% Asian 3% Native American 1%
- Hispanic origin (detail)
- Mexican 4% Puerto Rican 15% Dominican 13%
- Common ancestry
- Romanian 3% Polish 3% Iranian 1%
- Foreign-born
- 19% · Canada, Jamaica, Vietnam
- Languages at home
- 64% English-only · Spanish 30% Other Indo-European 1% Other Asian/Pacific 1%
Political lean MEDSL · Lehigh
- 2024 margin
- Toss-up / Even · D 50.7% · R 48.0% · Other 1.2%
- 2008→2024 swing
- -12.9pp toward R · 2008: 15.6pp · 2024: 2.7pp
- All cycles
- 2024: D+2.7 2020: D+7.6 2016: D+4.4 2012: D+7.5 2008: D+15.6
Not yet ingested
- Civics
- —
Market trends
- HPI YoY
- ▼ -358.28%
- Current HPI
- 298.1512
- Rent YoY
- ▲ 7.05%
- Metro
- Allentown-Bethlehem-Easton, PA-NJ
- State GDP YoY
- ▲ 1.68%
- F500 in state
- 34
Industry mix (Fortune 500 HQ in PA)
| Industry | F500 HQs | Revenue |
|---|---|---|
| Healthcare | 2 | $309B |
|
||
| Insurance | 2 | $27B |
|
||
| Telecommunications / Media | 1 | $124B |
|
||
| Industrial Distribution | 1 | $22B |
|
||
| Financial Services | 1 | $20B |
|
||
| Chemicals / Materials | 1 | $18B |
|
||
Price history
+830.3% since first listed17 events — show timeline
- 2026-05-06 Pending — GLVRMLS
- 2026-04-30 Price Changed $234,900 GLVRMLS
- 2026-04-14 Listed $239,900 GLVRMLS
- 2025-01-02 Sold (Public Records) $1,800,000 Public Records
- 2018-09-07 Sold (MLS) $66,000 GLVRMLS
- 2018-08-24 Pending — GLVRMLS
- 2018-08-20 Listed $69,900 GLVRMLS
- 2007-09-25 Sold (Public Records) $100,000 Public Records
- 2007-09-25 Sold (MLS) $100,000 GLVRMLS
- 2007-06-27 Listed $124,900 GLVRMLS
- 2004-05-10 Sold (Public Records) $65,000 Public Records
- 2004-05-04 Sold (MLS) $65,000 GLVRMLS
- 2004-01-24 Listed $80,000 GLVRMLS
- 2001-04-10 Sold (MLS) $17,000 GLVRMLS
- 2001-03-02 Listed $17,000 GLVRMLS
- 1990-08-01 Sold (Public Records) $64,900 Public Records
- 1984-01-23 Sold (Public Records) $25,250 Public Records
Property tax history
-2.0%/yrLatest (2026): $2,747 · +0.7% YoY. Source: county tax records.
Cash-flow waterfall
monthlySold comps — $/sqft
last 12 mo · ≤1 miLoading sold comps…