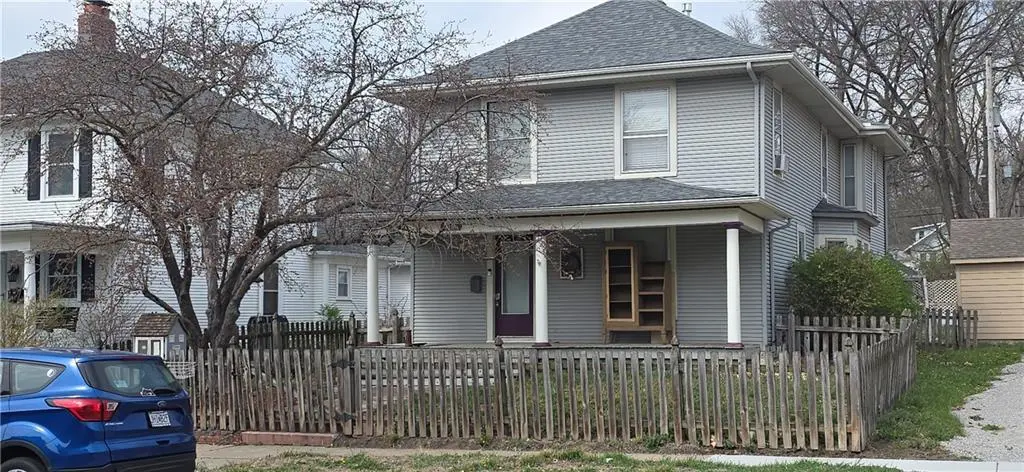
306 E Franklin St
Liberty, MO 64068
$199,900C
4 bd · 2.0 ba ·
2,120 sqft ·
Built 1900
· SingleFamily
· Pending
· 3 DOM
Cashflow @ list (25.0% down · 7.5%)
Estimated rent
$2,135/mo
Mortgage (P&I)
−$1,048
Tax + insurance
−$296
HOA
−$0
Vac / Maint / Mgmt
−$448
Net cashflow
$342/mo
Annual
$4,109/yr
Cap rate
8.35%
Cash-on-cash
7.34%
DSCR
1.33
1% rule
1.07%
Cash to close
$55,972
Investor read
- This is a 4-bed/2.0-bath single-family listed at $200k.
- At list price, monthly cash flow is $342 ($4k/yr) — positive.
- The deal already cash-flows at list — no discount required.
- Meets the 1% rule at list price ($2k rent vs $200k).
- Only 3 days on market — expect competitive offers; lowballing is unlikely to land.
- Local home prices are declining (-3.0%/yr); year-one equity from $1k of loan paydown is wiped out by about $6k of value loss. Plan a longer hold.
- Location reads 81/100 on livability (#15 in MO, #1,487 nationally) — a professional / high-income tenant draw. Strengths: employment A+, cost of living A+, housing A+; Watch: commute F.
- Liberty 53 (suburban): math 41% / reading 59% proficiency, ranked #24 of 324 in MO (top 7%) — acceptable for families but not a draw, mixed tenant base, ~2y average lease; only 15% free/reduced lunch — higher-income household profile.
- Zoned schools: Franklin Elem. (math 67% / reading 72%, grade A-, #28 of 1,115 statewide, top 3%, 245 students, 38% FRL); Liberty High (math 33% / reading 75%, grade C-, #82 of 521 statewide, top 16%, 1,997 students, 22% FRL) — zoned schools average 30% FRL vs 15% district-wide (15 pts higher); higher-poverty schools than district average — tighter screening recommended.
- Watch-outs: built in 1900 — expect roof / HVAC / electrical / plumbing capex.
- Market conditions: Rents rising fast (+4.7%/yr); 189 active listings in the ZIP; 4 comparable units currently listed for rent nearby; rentals at typical pace (median 24d on market — plan ~3-4 weeks tenant-placement turnaround); solid renter incomes; 341 units permitted in Clay County in 2024 (40 in 5+ unit buildings).
- Clay County population projected at +24% by 2050 — long-run rental-demand tailwind backs the buy-and-hold thesis.
- 2 sale attempts since 28y ago with the ask held roughly flat each time — persistent listings suggest the price (not the market) is what's stuck; bring a comps-based counter.
- Cap rate 8.3% vs local median 2.6% in Liberty — top-decile yield for the area; either an underpriced asset or a hidden risk that comps aren't pricing in. Stress-test before assuming the spread holds.
Questions for listing agent
- Built in 1900 — when were the roof, HVAC, electrical panel, plumbing, and water heater last replaced?
- Is there a deadline driving the sale (1031 exchange, divorce, estate, relocation)? That informs how much negotiation room exists.
- Schools are B-rated — typically a magnet for longer-tenancy family renters. What's the average tenant stay here, and is there a school-zone premium baked into asking?
- What's the average days-on-market for RENTAL listings here right now (not sales)? A rising rental-DOM trend means longer vacancies and softer asking-rent achievability than the comps imply.
- What's the recent tenant-quality profile in this submarket — average credit score on applications, eviction rate, late-payment / NSF rate, and stable-employment percentage? A property-management company in the area should have these aggregated.
- How much new for-sale + rental construction is in the pipeline within 1–3 miles? Heavy new supply typically softens prices + rents 12–24 months out; constrained supply supports both.
CashFlowRE · CFR-9HD81Z1V0HCB9Y
· Data 3 weeks ago
cashflowre.app · 2026-05-29