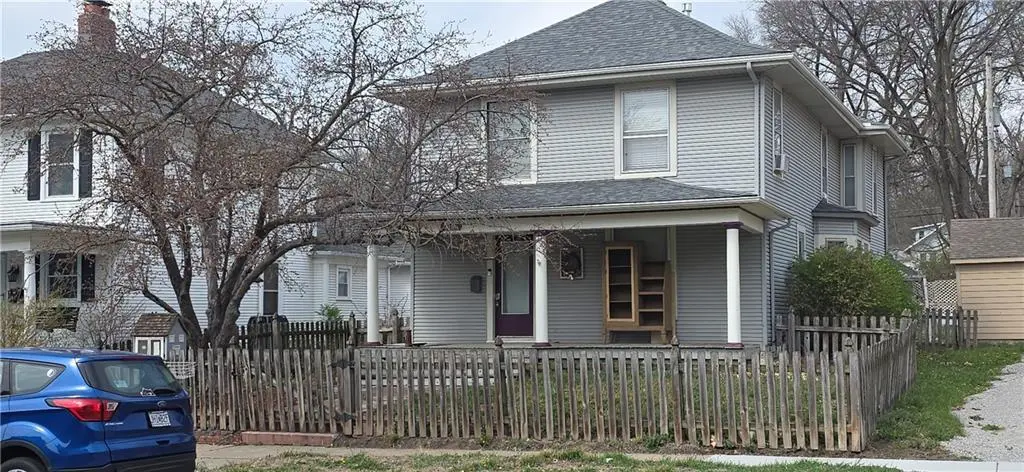
306 E Franklin St · Liberty, MO
Flood risk 1/10 · Minimal
- FEMA flood zone
- X (unshaded)
- Chance of flooding over 30 yrs
- 0.0%
- Est. flood insurance / yr
- $473 – $860
Fire risk 3/10 · Minor
- Est. fire insurance / yr
- $1,054 – $1,958
Heat risk 4/10 · Minor
- Hot days now (above 107°F)
- 7 days/yr
- Hot days in 30 yrs
- 17 days/yr
Wind risk 2/10 · Minimal
- Chance of severe wind over 30 yrs
- —
Air-quality risk 3/10 · Minor
- Unhealthy air days now
- 3 days/yr
- Unhealthy air days in 30 yrs
- 4 days/yr
Risk factors via First Street. Map © Google.
Why this score? — see what drove the C grade
The composite is a weighted blend of 9 inputs, each scored 0–100. Each bar is that input's sub-score; the figure is the points it added to the 100-point composite (weight × sub-score).
- Cash flow +22.7/30.0
- ARV discount +7.5/15.0
- DSCR +7.3/10.0
- 1% rule +5.7/10.0
- Schools +4.5/10.0
- Livability +4.0/5.0
- Rent growth +3.7/5.0
- Condition / age +2.5/5.0
- Appreciation +0.0/10.0
$199,900
🖨 Deal sheet 📄 Offer letter ✓ Due diligence
Listing remarks MLS
Lots Of Room-New Roof, Paint, Hot Water Heater, Floor Covering. Fenced Back Yard. 291 Hwy To Kansas St(Also 152 Hwy) East On Kansas St To Lightburn, Left On
Key facts
- 0.24 acre lot
- 2 garage spots
- Listed 3 days
Neighborhood map
What this means for you Summary
Snapshot
- This is a 4-bed/2.0-bath single-family listed at $200k.
Deal economics
- At list price, monthly cash flow is $342 ($4k/yr) — positive.
- The deal already cash-flows at list — no discount required.
- Meets the 1% rule at list price ($2k rent vs $200k).
- Cap rate 8.3% vs local median 2.6% in Liberty — top-decile yield for the area; either an underpriced asset or a hidden risk that comps aren't pricing in. Stress-test before assuming the spread holds.
Location & tenants
- Location reads 81/100 on livability (#15 in MO, #1,487 nationally) — a professional / high-income tenant draw. Strengths: employment A+, cost of living A+, housing A+; Watch: commute F.
- Liberty 53 (suburban): math 41% / reading 59% proficiency, ranked #24 of 324 in MO (top 7%) — acceptable for families but not a draw, mixed tenant base, ~2y average lease; only 15% free/reduced lunch — higher-income household profile.
- Zoned schools: Franklin Elem. (math 67% / reading 72%, grade A-, #28 of 1,115 statewide, top 3%, 245 students, 38% FRL); Liberty High (math 33% / reading 75%, grade C-, #82 of 521 statewide, top 16%, 1,997 students, 22% FRL) — zoned schools average 30% FRL vs 15% district-wide (15 pts higher); higher-poverty schools than district average — tighter screening recommended.
- Market conditions: Rents rising fast (+4.7%/yr); 189 active listings in the ZIP; 4 comparable units currently listed for rent nearby; rentals at typical pace (median 24d on market — plan ~3-4 weeks tenant-placement turnaround); solid renter incomes; 341 units permitted in Clay County in 2024 (40 in 5+ unit buildings).
Forward outlook
- Local home prices are declining (-3.0%/yr); year-one equity from $1k of loan paydown is wiped out by about $6k of value loss. Plan a longer hold.
- Clay County population projected at +24% by 2050 — long-run rental-demand tailwind backs the buy-and-hold thesis.
Negotiation context
- Only 3 days on market — expect competitive offers; lowballing is unlikely to land.
- 2 sale attempts since 28y ago with the ask held roughly flat each time — persistent listings suggest the price (not the market) is what's stuck; bring a comps-based counter.
Risks & watch-outs
- Watch-outs: built in 1900 — expect roof / HVAC / electrical / plumbing capex.
Questions for the listing agent
- Built in 1900 — when were the roof, HVAC, electrical panel, plumbing, and water heater last replaced?
- Is there a deadline driving the sale (1031 exchange, divorce, estate, relocation)? That informs how much negotiation room exists.
- Schools are B-rated — typically a magnet for longer-tenancy family renters. What's the average tenant stay here, and is there a school-zone premium baked into asking?
- What's the average days-on-market for RENTAL listings here right now (not sales)? A rising rental-DOM trend means longer vacancies and softer asking-rent achievability than the comps imply.
- What's the recent tenant-quality profile in this submarket — average credit score on applications, eviction rate, late-payment / NSF rate, and stable-employment percentage? A property-management company in the area should have these aggregated.
- How much new for-sale + rental construction is in the pipeline within 1–3 miles? Heavy new supply typically softens prices + rents 12–24 months out; constrained supply supports both.
Investment metrics
- 1% rule
- 1.07% ✓
- Cap rate
- 8.35%
- Cash-on-cash
- 7.34%
- DSCR
- 1.33
- GRM
- 7.8
CMA / ARV
- ARV (on-the-fly)
- $424,000
- Comps found
- 12
Show comp detail 12 sales within ~0.75 mi
| Address | Dist | Beds/Ba | Sqft | Sold | Price | $/sf | Match |
|---|---|---|---|---|---|---|---|
| 521 Ella's Way | 0.65mi | 4/2.5 | 2,053 (-3%) | 0mo | $399,990 | $195 | 62 |
| 206 Groom St | 0.50mi | 3/2.0 (-1) | 2,176 (+3%) | 7mo | $200,000 | $92 | 62 |
| 600 Izzy Way | 0.64mi | 4/3.0 | 2,190 (+3%) | 2mo | $470,000 | $215 | 59 |
| 500 Ella's Way | 0.71mi | 4/2.5 | 2,053 (-3%) | 0mo | $412,990 | $201 | 59 |
| 509 Ella's Way | 0.65mi | 4/3.0 | 2,042 (-4%) | 3mo | $463,990 | $227 | 57 |
| 604 Izzy Way | 0.65mi | 4/3.0 | 2,042 (-4%) | 3mo | $409,990 | $201 | 57 |
| 512 Ella's Way | 0.73mi | 4/2.5 | 2,053 (-3%) | 3mo | $409,990 | $200 | 56 |
| 513 Ella's Way | 0.70mi | 4/3.0 | 2,042 (-4%) | 1mo | $455,990 | $223 | 56 |
| 501 W Franklin St | 0.54mi | 4/2.0 | 1,917 (-10%) | 8mo | $300,000 | $156 | 52 |
| 134 S Lincoln St | 0.25mi | 3/3.0 (-1) | 1,852 (-13%) | 7mo | $265,000 | $143 | 52 |
| 601 Izzy Way | 0.61mi | 4/2.5 | 2,356 (+11%) | 3mo | $436,990 | $185 | 49 |
| 631 Cosby St | 0.58mi | 3/2.5 (-1) | 1,904 (-10%) | 1mo | $310,000 | $163 | 48 |
Match score weights: distance 35% · size 25% · config 20% · recency 20%. Top-matched comps best support the ARV.
Projected returns pro-forma
-3.0% appreciation · 4.69% rent growth · sell at horizon
- IRR
- -3.2%
- Equity multiple
- 0.88×
- Total profit
- $-6,880
- Equity at exit
- $29,806
- IRR
- 8.3%
- Equity multiple
- 1.68×
- Total profit
- $37,814
- Equity at exit
- $17,284
Cash invested: $55,972 (down + closing). Projections, not guarantees.
Landlord ↔ Tenant lean methodology
- Overall (STATE)
- 81 Strongly Landlord-Friendly
- State Missouri
- 81 Strongly Landlord-Friendly · R+10
- County
- — inherits STATE
- City
- — inherits STATE
ZIP-level market 64068
- Rents YoY
- 4.7%
- Active inventory
- 189
- Price-to-rent
- 7.8×
Monthly cashflow live
- Estimated rent
- $2,135 medium interval (Pro) →
- Mortgage (P&I)
- −$1,048
- Tax from tax record
- −$213 /mo · $2,553/yr
- Insurance
- −$83
- HOA
- −$0
- Vacancy / Maint / Mgmt
- −$448
- Net cashflow
- $342
Break-even live
UW: 25.0% down · 7.5% · 30yr · 1.5% tax · 5.0% vac · 8.0% maint · 8.0% mgmt
Financing live
Cash to close
- Down payment
- $49,975
- Closing costs
- $5,997
- Reserves months
- —
- Total cash needed
- —
Loan-product check · same deal, 3 products live
Conventional
25% down · 7.5% · 30yr
- Down + closing
- —
- Monthly P&I
- —
- Monthly cashflow
- —
- DSCR
- —
- Eligible?
- —
Personal DTI + credit; lowest rate.
DSCR
20% down · 8.5% · 30yr
- Down + closing
- —
- Monthly P&I
- —
- Monthly cashflow
- —
- DSCR
- —
- Eligible?
- —
No personal income docs; deal must DSCR.
Hard money
10% down · 12.0% · 12mo
- Down + closing
- —
- Monthly P&I
- —
- Monthly cashflow
- —
- DSCR
- —
- Eligible?
- —
Short-term bridge; refi at stabilization.
Rent comps 4 comps
| Address | Beds | Baths | Sqft | Rent | $/sqft | DOM | Units | Dist |
|---|---|---|---|---|---|---|---|---|
| 633 N Gallatin St Liberty, MO | 4.0 | 2.0 | 1850 | $1,895 | $1.02 | 23d | 1 | 0.58mi |
| 1305 Craig Dr Liberty, MO | 4.0 | 3.0 | 1881 | $2,750 | $1.46 | 14d | 1 | 0.95mi |
| 1502 McClellan Dr Liberty, MO | 3.0 | 1.0 | 1518 | $1,690 | $1.11 | 12d | 1 | 1.17mi |
| 1502 Telford Dr Liberty, MO | 4.0 | 4.5 | 2481 | $2,879 | $1.16 | 23d | 1 | 1.45mi |
Listing history 5 events
-
2026-04-05status Pending
-
2026-04-01$199,900 Active
-
1998-09-14soldstatus 156-char remark
Show marketing remark (156 chars)
Lots Of Room-New Roof, Paint, Hot Water Heater, Floor Covering. Fenced Back Yard. 291 Hwy To Kansas St(Also 152 Hwy) East On Kansas St To Lightburn, Left On
-
1998-09-11soldstatus
-
1998-02-15$89,900 156-char remark
Show marketing remark (156 chars)
Lots Of Room-New Roof, Paint, Hot Water Heater, Floor Covering. Fenced Back Yard. 291 Hwy To Kansas St(Also 152 Hwy) East On Kansas St To Lightburn, Left On
ⓘ Source: listings_history table (triggers on properties + properties_extension) + one-shot
backfill from property_details.listing_events for pre-trigger history.
Tax reassessment forecast MO · Resets to sale price
- Current annual tax
- $2,553 · $213/mo
- Projected year-2 tax
- $2,553 · $213/mo
- Expected delta
- $0/yr ($0/mo · 0.0%)
ⓘ Screening estimate from a state-policy table — verify with the county assessor before closing.
Climate risk First Street
- Flood 1/10 Low FEMA zone X (unshaded) · 0% chance over 30 yrs
- Wildfire 3/10 Moderate
- Heat 4/10 Moderate 7 d/yr ≥107°F today · 17 d/yr by 30 yrs out
- Wind 2/10 Low
- Air quality 3/10 Moderate 3 unhealthy d/yr today · 4 by 30 yrs out
Nearby sold comps map
Loading sold comps map…
Walkable amenities ~0.75 mi
Loading nearby amenities…
Taxation est. · year 1
- Rental income
- $25,622
- − Mortgage interest
- −$11,198
- − Property taxes
- −$2,553
- − Insurance
- −$1,000
- − Repairs & maintenance
- −$2,050
- − Management
- −$2,050
- − Depreciation
- −$5,815
- Taxable income
- $957
- Est. tax owed @ 24.0%
- −$230
- After-tax cash flow
- $3,880/yr
For passive investors: Depreciation is non-cash, so a rental often shows a tax loss while cash-flowing — sheltering income. Rental losses are passive: they offset passive income freely, and up to $25,000/yr can offset ordinary (W-2) income if you actively participate and your MAGI is under $100k (phasing out to $0 by $150k); unused losses carry forward. On sale, claimed depreciation is recaptured at up to 25%, and gains may owe capital-gains tax (a 1031 exchange can defer both). Figures are a year-1 estimate at your 24.0% rate — not tax advice; consult a CPA.
Schools (NCES district)
- District
- Liberty 53
- NCES district ID
- 2918540
- Math proficiency
- 41% ▼ -9.00%
- Reading proficiency
- 59% ▼ -3.00%
- Median HH income
- $78,226
- Composite
- 45.41/100
- National rank
- #2624
- State rank
- #24 of 324 in MO
Livability — Liberty
- Score
- 81/100
- State rank
- #15
- US rank
- #1487
Category grades
Schools grade is shown separately in the Schools card above.
Census & demographics
- Census place
- Liberty, MO
- County
- Clay County · 220,651 people
- City population
- 37,758
- Metro
- Kansas City, MO-KS
- Population (ZIP)
- 37,758
- Household income
- $92,297
- Rent vs Own
- Severe rent burden
- 695.0
Population outlook (Clay County) Hauer SSP2
- Today (2025)
- 266,022 people
- By 2030
- 280,057 · +5.3%
- By 2040
- 306,153 · +15.1%
- By 2050
- 328,630 · +23.5%
- By 2075
- 375,182 · +41.0%
- By 2100
- 392,861 · +47.7%
Race, ethnicity, and origin ACS 2023
- Neighborhood character
- Predominantly White (85%)
- Race & ethnicity
- White 85% Hispanic / Latino 5% Two or more races 5% Black 4% Asian 2%
- Hispanic origin (detail)
- Mexican 3%
- Common ancestry
- Lithuanian 3% Italian 3% Slovak 3%
- Foreign-born
- 2% · Canada, China
- Languages at home
- 97% English-only · Spanish 1%
Political lean MEDSL · Clay
- 2024 margin
- Lean R (+5.6) · D 46.4% · R 52.0% · Other 1.6%
- 2008→2024 swing
- -4.9pp toward R · 2008: -0.7pp · 2024: -5.6pp
- All cycles
- 2024: R+5.6 2020: R+4.1 2016: R+11.1 2012: R+8.4 2008: R+0.7
Not yet ingested
- Civics
- —
Market trends
- HPI YoY
- ▼ -233.70%
- Current HPI
- 223.1569
- Rent YoY
- ▲ 4.69%
- Metro
- Kansas City, MO-KS
- State GDP YoY
- ▲ 1.84%
- F500 in state
- 20
Industry mix (Fortune 500 HQ in MO)
| Industry | F500 HQs | Revenue |
|---|---|---|
| Healthcare | 1 | $163B |
|
||
| Insurance | 1 | $21B |
|
||
| Industrial Technology | 1 | $17B |
|
||
| Retail | 1 | $16B |
|
||
| Industrial Distribution | 1 | $10B |
|
||
| Utilities | 1 | $9B |
|
||
Price history
+122.4% since first listed5 events — show timeline
- 2026-04-05 Pending — Heartland MLS as Distributed by MLS Grid
- 2026-04-01 Listed $199,900 Heartland MLS as Distributed by MLS Grid
- 1998-09-14 Sold (MLS) — Heartland MLS as Distributed by MLS Grid
- 1998-09-11 Sold (Public Records) — Public Records
- 1998-02-15 Listed $89,900 Heartland MLS as Distributed by MLS Grid
Property tax history
+2.0%/yrLatest (2025): $2,553 · +4.8% YoY. Source: county tax records.
Cash-flow waterfall
monthlySold comps — $/sqft
last 12 mo · ≤1 miLoading sold comps…