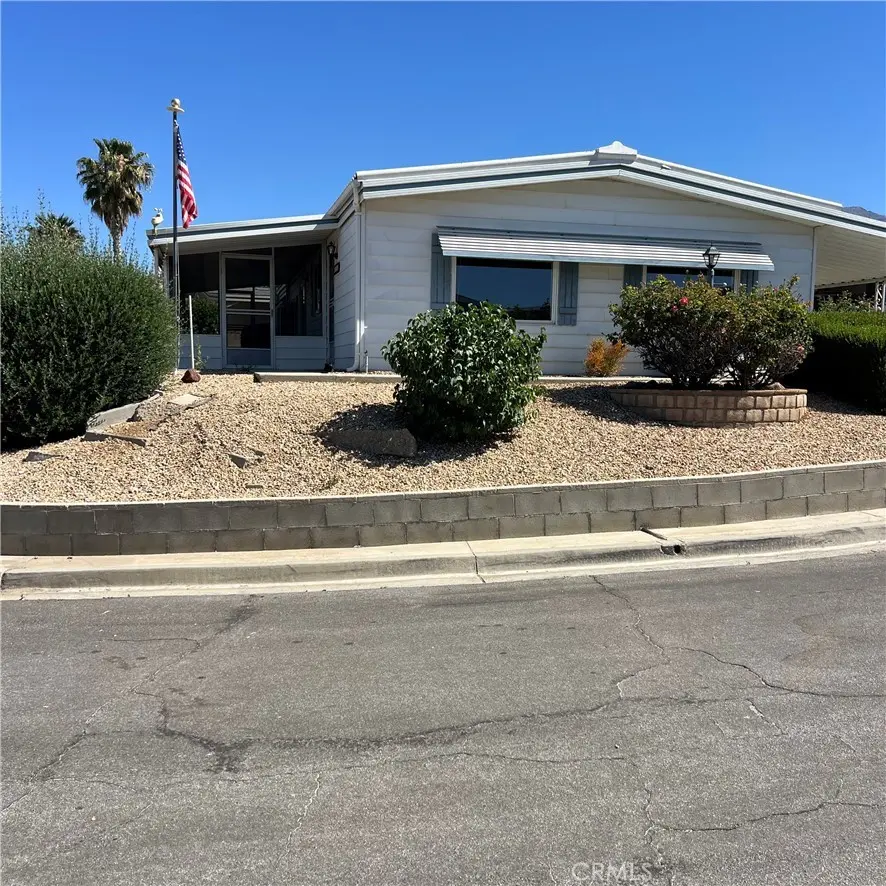
41120 Nez Perce Cir
Cherry Valley, CA 92223
$265,000D
2 bd · 2.0 ba ·
1,344 sqft ·
Built 1977
· Manufactured
· Active
· 16 DOM
Cashflow @ list (25.0% down · 7.5%)
Estimated rent
$2,543/mo
Mortgage (P&I)
−$1,390
Tax + insurance
−$256
HOA
−$182
Vac / Maint / Mgmt
−$534
Net cashflow
$181/mo
Annual
$2,170/yr
Cap rate
7.11%
Cash-on-cash
2.93%
DSCR
1.13
1% rule
0.96%
Cash to close
$74,200
Investor read
- This is a 2-bed/2.0-bath manufactured listed at $265k.
- At list price, monthly cash flow is $181 ($2k/yr) — positive.
- The deal already cash-flows at list — no discount required.
- To meet the 1% rule (rent ≥ 1% of price), the offer needs to be $254k (4.1% below list).
- It's been on market 16 days — a 2% lower offer ($261k) is reasonable based on typical stale-listing flexibility.
- Recommended offer: $254k (4.1% below list) — sets the bar for 1% rule.
- Local home prices are declining (-3.0%/yr); year-one equity from $2k of loan paydown is wiped out by about $8k of value loss. Plan a longer hold.
- Location reads 50/100 on livability (#1,107 in CA) — a working-class tenant base; expect higher turnover. Strengths: housing A+; Watch: schools F, crime D-, amenities F.
- Beaumont Unified (suburban): math 32% / reading 60% proficiency, ranked #168 of 517 in CA (top 32%) — families likely to look elsewhere, expect single-tenant / working-renter base with shorter leases.
- Market conditions: Rents rising (+3.9%/yr); 286 active listings in the ZIP; 3 comparable units currently listed for rent nearby; rentals leasing fast (median 0d on market — plan ~1-2 weeks tenant-placement turnaround); solid renter incomes; 9,195 units permitted in Riverside County in 2024 (1,512 in 5+ unit buildings).
- Riverside County population projected at +22% by 2050 — long-run rental-demand tailwind backs the buy-and-hold thesis.
- 2 sale attempts since 12y ago with the ask held roughly flat each time — persistent listings suggest the price (not the market) is what's stuck; bring a comps-based counter.
- Current owner paid $108k; list at $265k implies a 145% gain — meaningful room to come down on a strong offer.
- Climate carrying-cost: severe wildfire risk; extreme-heat days projected 7→21/yr by 2055 (HVAC capex compounding) — expect insurance premiums to compound above CPI over the hold.
- Cap rate 7.1% vs local median 4.3% in Cherry Valley — top-decile yield for the area; either an underpriced asset or a hidden risk that comps aren't pricing in. Stress-test before assuming the spread holds.
Questions for listing agent
- Built in 1977 — when were the roof, HVAC, electrical panel, plumbing, and water heater last replaced?
- What does the HOA fee cover, when was the last increase, and are there any pending special assessments or reserve-fund shortfalls?
- Is there a deadline driving the sale (1031 exchange, divorce, estate, relocation)? That informs how much negotiation room exists.
- Schools are F-rated, which usually means shorter tenancies and higher turnover. Who's the typical renter profile here, and what's been the actual vacancy rate?
- Crime grade is D in this area — have there been break-ins, vandalism, or insurance claims at this property in the last 3 years? What carrier currently insures it and at what premium?
- The area grade is low — what's the realistic commute time and amenity access for the typical tenant pool here? Any planned neighborhood developments (good or bad) we should know about?
- What's the average days-on-market for RENTAL listings here right now (not sales)? A rising rental-DOM trend means longer vacancies and softer asking-rent achievability than the comps imply.
- What's the recent tenant-quality profile in this submarket — average credit score on applications, eviction rate, late-payment / NSF rate, and stable-employment percentage? A property-management company in the area should have these aggregated.
CashFlowRE · CFR-9JB0TF1AHYHKGQ
· Data 10 h ago
cashflowre.app · 2026-05-29