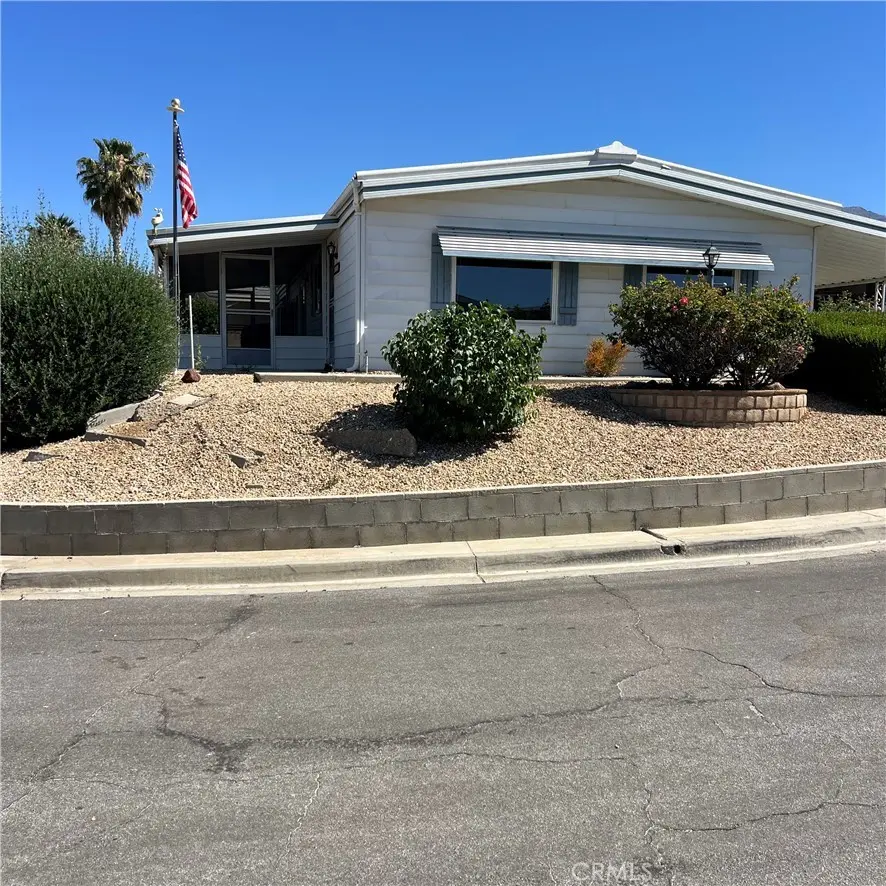
41120 Nez Perce Cir · Cherry Valley, CA
Flood risk 4/10 · Minor
- FEMA flood zone
- X (unshaded)
- Chance of flooding over 30 yrs
- 0.22%
- Est. flood insurance / yr
- $507 – $1,088
Fire risk 9/10 · Severe
- Est. fire insurance / yr
- $659 – $1,223
Heat risk 6/10 · Moderate
- Hot days now (above 100°F)
- 7 days/yr
- Hot days in 30 yrs
- 21 days/yr
Wind risk 1/10 · Minimal
- Chance of severe wind over 30 yrs
- —
Air-quality risk 10/10 · Severe
- Unhealthy air days now
- 38 days/yr
- Unhealthy air days in 30 yrs
- 45 days/yr
Risk factors via First Street. Map © Google.
Why this score? — see what drove the D grade
The composite is a weighted blend of 9 inputs, each scored 0–100. Each bar is that input's sub-score; the figure is the points it added to the 100-point composite (weight × sub-score).
- Cash flow +17.0/30.0
- DSCR +5.3/10.0
- ARV discount +5.3/15.0
- 1% rule +4.6/10.0
- Schools +4.0/10.0
- Rent growth +3.5/5.0
- Livability +2.5/5.0
- Condition / age +2.5/5.0
- Appreciation +0.0/10.0
$265,000
🖨 Deal sheet (PDF) 📄 Offer letter ✓ Due diligence
Listing remarks MLS
Best deal in Highland Springs Village. Home sits on a corner lot, which features 2 bedrooms, 2 bathrooms, a large screened in porch to sit in and catch the evening breeze while enjoying the city lights. Over sized family room, and dinning rooms. There is a fireplace in the living room to keep cozy with, a spacious walk-in kitchen, and two separates carport's for parking. Low maintenance front, and back yard with 2 storage sheds. Come and enjoy all the amenities that the club house has to offer including free GOLF. ..
Key facts
- Large covered porch
- Spacious corner lot
- Updated kitchen
Tags
Property features AI
Finance
- HOA & community: Part of Highland Springs Village association; Monthly association fee; Association fee: $182 per month; Senior community; Association amenities include pool, spa, tennis, pickleball, gym/exercise room, clubhouse, banquet facilities, meeting and card rooms, picnic and barbecue areas, onsite property management, and multipurpose/recreational room; Community features include rural setting and street lighting
Exterior
- Parking: Carport; 3 carport spaces; 3 uncovered spaces; Total of 6 parking spaces
- Security: Smoke detector(s); Carbon monoxide detector(s)
- Utilities: Natural gas connected; Electricity connected (standard); Public sewer; Sewer connected; Water connected; Telephone available in street; Cable available
- Home design: Planned development community; Faces west; One story; Entry at ground level; No accessory dwelling unit
- Construction: Permanent foundation; Certified 433-a
- Exterior features: Manufactured house; Covered and screened porch/patio; Open patio; Shed; Wrought iron fencing; Sprinklers (drip system); Has view; Located on a cul-de-sac with rolling slope
Interior
- Kitchen: Gas cooktop; Gas oven; Microwave; Dishwasher; Garbage disposal; Quartz counters; Kitchen open to family room; Breakfast counter/bar; Remodeled kitchen; Family kitchen with eating area
- Bedrooms: Primary bedroom on the main floor; All bedrooms on the main floor; 2 main-level bedrooms
- Flooring: Laminated flooring
- Bathrooms: 2 full bathrooms; Bathrooms include bathtub and shower
- Heating & cooling: Central furnace heating; Central cooling; Evaporative cooling
- Interior features: Ceiling fan; Pantry; Double-pane windows; Smoke and carbon monoxide detectors; Turnkey condition; One level
- Laundry & utility: In-unit laundry room; Washer included; Washer hookup; Gas dryer hookup; Individual laundry room; Utility room
Neighborhood map
What this means for you Summary
Snapshot
- This is a 2-bed/2.0-bath manufactured listed at $265k.
Deal economics
- At list price, monthly cash flow is $181 ($2k/yr) — positive.
- The deal already cash-flows at list — no discount required.
- To meet the 1% rule (rent ≥ 1% of price), the offer needs to be $254k (4.1% below list).
- Recommended offer: $254k (4.1% below list) — sets the bar for 1% rule.
- Cap rate 7.1% vs local median 4.3% in Cherry Valley — top-decile yield for the area; either an underpriced asset or a hidden risk that comps aren't pricing in. Stress-test before assuming the spread holds.
Location & tenants
- Location reads 50/100 on livability (#1,107 in CA) — a working-class tenant base; expect higher turnover. Strengths: housing A+; Watch: schools F, crime D-, amenities F.
- Beaumont Unified (suburban): math 32% / reading 60% proficiency, ranked #168 of 517 in CA (top 32%) — families likely to look elsewhere, expect single-tenant / working-renter base with shorter leases.
- Market conditions: Rents rising (+3.9%/yr); 286 active listings in the ZIP; 3 comparable units currently listed for rent nearby; rentals leasing fast (median 0d on market — plan ~1-2 weeks tenant-placement turnaround); solid renter incomes; 9,195 units permitted in Riverside County in 2024 (1,512 in 5+ unit buildings).
Forward outlook
- Local home prices are declining (-3.0%/yr); year-one equity from $2k of loan paydown is wiped out by about $8k of value loss. Plan a longer hold.
- Riverside County population projected at +22% by 2050 — long-run rental-demand tailwind backs the buy-and-hold thesis.
Negotiation context
- It's been on market 16 days — a 2% lower offer ($261k) is reasonable based on typical stale-listing flexibility.
- 2 sale attempts since 12y ago with the ask held roughly flat each time — persistent listings suggest the price (not the market) is what's stuck; bring a comps-based counter.
- Current owner paid $108k; list at $265k implies a 145% gain — meaningful room to come down on a strong offer.
Risks & watch-outs
- Climate carrying-cost: severe wildfire risk; extreme-heat days projected 7→21/yr by 2055 (HVAC capex compounding) — expect insurance premiums to compound above CPI over the hold.
Questions for the listing agent
- Built in 1977 — when were the roof, HVAC, electrical panel, plumbing, and water heater last replaced?
- What does the HOA fee cover, when was the last increase, and are there any pending special assessments or reserve-fund shortfalls?
- Is there a deadline driving the sale (1031 exchange, divorce, estate, relocation)? That informs how much negotiation room exists.
- Schools are F-rated, which usually means shorter tenancies and higher turnover. Who's the typical renter profile here, and what's been the actual vacancy rate?
- Crime grade is D in this area — have there been break-ins, vandalism, or insurance claims at this property in the last 3 years? What carrier currently insures it and at what premium?
- The area grade is low — what's the realistic commute time and amenity access for the typical tenant pool here? Any planned neighborhood developments (good or bad) we should know about?
- What's the average days-on-market for RENTAL listings here right now (not sales)? A rising rental-DOM trend means longer vacancies and softer asking-rent achievability than the comps imply.
- What's the recent tenant-quality profile in this submarket — average credit score on applications, eviction rate, late-payment / NSF rate, and stable-employment percentage? A property-management company in the area should have these aggregated.
- How much new for-sale + rental construction is in the pipeline within 1–3 miles? Heavy new supply typically softens prices + rents 12–24 months out; constrained supply supports both.
Investment metrics
- 1% rule
- 0.96% ✗
- Cap rate
- 7.11%
- Cash-on-cash
- 2.93%
- DSCR
- 1.13
- GRM
- 8.7
CMA / ARV
- ARV (on-the-fly)
- $252,672
- Comps found
- 12
Show comp detail 12 sales within ~0.75 mi
| Address | Dist | Beds/Ba | Sqft | Sold | Price | $/sf | Match |
|---|---|---|---|---|---|---|---|
| 10420 Chisholm Trl | 0.09mi | 3/2.0 (+1) | 1,344 (0%) | 1mo | $195,000 | $145 | 90 |
| 10165-10165 Frontier Trl | 0.34mi | 2/2.0 | 1,344 (0%) | 3mo | $245,000 | $182 | 82 |
| 10321 Chisholm Trl | 0.10mi | 2/2.0 | 1,440 (+7%) | 6mo | $245,000 | $170 | 78 |
| 41238 Cheyenne Trl | 0.10mi | 2/2.0 | 1,464 (+9%) | 4mo | $220,000 | $150 | 77 |
| 40972 Cheyenne Trl | 0.16mi | 2/2.0 | 1,440 (+7%) | 11mo | $235,000 | $163 | 71 |
| 40862 Laredo Trl | 0.21mi | 2/2.0 | 1,440 (+7%) | 9mo | $240,000 | $167 | 71 |
| 40798 Cheyenne Trl | 0.27mi | 2/2.0 | 1,440 (+7%) | 8mo | $325,000 | $226 | 68 |
| 10514 Arapahoe Cir | 0.28mi | 2/2.0 | 1,440 (+7%) | 15mo | $296,000 | $206 | 63 |
| 10015 Comanche Cir | 0.35mi | 2/2.0 | 1,464 (+9%) | 13mo | $310,000 | $212 | 58 |
| 10255 Frontier Trl | 0.34mi | 2/2.0 | 1,488 (+11%) | 11mo | $292,750 | $197 | 57 |
| 10845 Bel Air Dr | 0.49mi | 2/2.0 | 1,392 (+4%) | 21mo | $301,000 | $216 | 53 |
| 10776-10776 Cherry Hills Ln Unit N a | 0.47mi | 2/2.0 | 1,488 (+11%) | 23mo | $280,000 | $188 | 41 |
Match score weights: distance 35% · size 25% · config 20% · recency 20%. Top-matched comps best support the ARV.
Projected returns pro-forma
-3.0% appreciation · 3.85% rent growth · sell at horizon
- IRR
- -10.7%
- Equity multiple
- 0.61×
- Total profit
- $-29,192
- Equity at exit
- $39,512
- IRR
- -0.2%
- Equity multiple
- 0.98×
- Total profit
- $-1,284
- Equity at exit
- $22,912
Cash invested: $74,200 (down + closing). Projections, not guarantees.
Landlord ↔ Tenant lean methodology
- Overall (STATE)
- 18 Strongly Tenant-Friendly
- State California
- 18 Strongly Tenant-Friendly · D+13
- County
- — inherits STATE
- City
- — inherits STATE
ZIP-level market 92223
- Rents YoY
- 3.9%
- Active inventory
- 286
- Price-to-rent
- 8.7×
Monthly cashflow live
- Estimated rent
- $2,543 medium interval (Pro) →
- Mortgage (P&I)
- −$1,390
- Tax from tax record
- −$146 /mo · $1,749/yr
- Insurance
- −$110
- HOA
- −$182
- Vacancy / Maint / Mgmt
- −$534
- Net cashflow
- $181
Break-even live
Sensitivity live
| Price | -10% $331 | -5% $256 | +0% $181 | +5% $106 | +10% $31 |
|---|---|---|---|---|---|
| Rent | -10% $-20 | -5% $80 | +0% $181 | +5% $281 | +10% $382 |
| Rate | -1.0pp $314 | -0.5pp $248 | base $181 | +0.5pp $112 | +1.0pp $42 |
UW: 25.0% down · 7.5% · 30yr · 1.5% tax · 5.0% vac · 8.0% maint · 8.0% mgmt
Financing live
Cash to close
- Down payment
- $66,250
- Closing costs
- $7,950
- Reserves months
- —
- Total cash needed
- —
Loan-product check · same deal, 3 products live
Conventional
25% down · 7.5% · 30yr
- Down + closing
- —
- Monthly P&I
- —
- Monthly cashflow
- —
- DSCR
- —
- Eligible?
- —
Personal DTI + credit; lowest rate.
DSCR
20% down · 8.5% · 30yr
- Down + closing
- —
- Monthly P&I
- —
- Monthly cashflow
- —
- DSCR
- —
- Eligible?
- —
No personal income docs; deal must DSCR.
Hard money
10% down · 12.0% · 12mo
- Down + closing
- —
- Monthly P&I
- —
- Monthly cashflow
- —
- DSCR
- —
- Eligible?
- —
Short-term bridge; refi at stabilization.
Rent comps 3 comps
| Address | Beds | Baths | Sqft | Rent | $/sqft | DOM | Units | Dist |
|---|---|---|---|---|---|---|---|---|
| 9985 Frontier Trl Cherry Valley, CA | 2.0 | 2.0 | 1056 | $2,300 | $2.18 | 18d | 1 | 0.29mi |
| 10770 Deerfield Dr Cherry Valley, CA | 3.0 | 2.0 | 1628 | $2,295 | $1.41 | 0d | 1 | 0.52mi |
| 39670 Grand Ave Cherry Valley, CA | 3.0 | 2.0 | 1578 | $2,595 | $1.64 | 0d | 1 | 1.49mi |
HOA detail
- Monthly dues
- $182 · $2,184/yr
Listing history 11 events
-
2026-06-21days on market $265,000 Active 16 DOM
-
2026-06-18days on market $265,000 Active 13 DOM
-
2026-06-17days on market $265,000 Active 12 DOM
-
2026-06-16days on market $265,000 Active 11 DOM
-
2026-06-15days on market $265,000 Active 10 DOM
-
2026-06-13days on market $265,000 Active 8 DOM
-
2026-06-13days on market $265,000 Active 7 DOM
-
2026-06-09days on market $265,000 Active 4 DOM
-
2026-06-08days on market $265,000 Active 3 DOM
-
2026-06-07remarks 699-char remark
-
2026-06-07$265,000 Active 2 DOM
ⓘ Source: listings_history table (triggers on properties + properties_extension) + one-shot
backfill from property_details.listing_events for pre-trigger history.
Tax reassessment forecast CA · Resets to sale price
- Current annual tax
- $1,749 · $146/mo
- Projected year-2 tax
- $2,014 · $168/mo
- Expected delta
- +$265/yr (+$22/mo · 15.2%)
ⓘ Screening estimate from a state-policy table — verify with the county assessor before closing.
Climate risk First Street
- Flood 4/10 Moderate FEMA zone X (unshaded) · 22% chance over 30 yrs
- Wildfire 9/10 Extreme
- Heat 6/10 Major 7 d/yr ≥100°F today · 21 d/yr by 30 yrs out
- Wind 1/10 Low
- Air quality 10/10 Extreme 38 unhealthy d/yr today · 45 by 30 yrs out
Nearby sold comps map
Loading sold comps map…
Walkable amenities ~0.75 mi
Loading nearby amenities…
Taxation est. · year 1
- Rental income
- $30,512
- − Mortgage interest
- −$14,844
- − Property taxes
- −$1,749
- − Insurance
- −$1,325
- − Repairs & maintenance
- −$2,441
- − Management
- −$2,441
- − HOA
- −$2,184
- − Depreciation
- −$7,709
- Taxable loss
- −$2,181
- Est. tax savings @ 24.0%
- +$523
- After-tax cash flow
- $2,694/yr
For passive investors: Depreciation is non-cash, so a rental often shows a tax loss while cash-flowing — sheltering income. Rental losses are passive: they offset passive income freely, and up to $25,000/yr can offset ordinary (W-2) income if you actively participate and your MAGI is under $100k (phasing out to $0 by $150k); unused losses carry forward. On sale, claimed depreciation is recaptured at up to 25%, and gains may owe capital-gains tax (a 1031 exchange can defer both). Figures are a year-1 estimate at your 24.0% rate — not tax advice; consult a CPA.
Schools (NCES district)
- District
- Beaumont Unified
- NCES district ID
- 0604290
- Math proficiency
- 32% ▼ -4.00%
- Reading proficiency
- 60% ▲ 11.00%
- Median HH income
- $60,635
- Composite
- 40.37/100
- National rank
- #3736
- State rank
- #168 of 517 in CA
Livability — Cherry Valley
- Score
- 50/100
- State rank
- #1107
- US rank
- #25562
Category grades
Schools grade is shown separately in the Schools card above.
Census & demographics
- Census place
- Cherry Valley, CA
- County
- Riverside County · 2,287,001 people
- Metro
- Riverside-San Bernardino-Ontario, CA
- Population (ZIP)
- 63,833
- Household income
- $102,761
- Rent vs Own
- Severe rent burden
- 1096.0
Population outlook (Riverside County) Hauer SSP2
- Today (2025)
- 2,664,475 people
- By 2030
- 2,802,692 · +5.2%
- By 2040
- 3,050,904 · +14.5%
- By 2050
- 3,256,783 · +22.2%
- By 2075
- 3,655,058 · +37.2%
- By 2100
- 3,766,594 · +41.4%
Race, ethnicity, and origin ACS 2023
- Neighborhood character
- Diverse neighborhood (Simpson 0.65)
- Race & ethnicity
- Hispanic / Latino 45% White 37% Two or more races 16% Black 8% Asian 7% Native American 1%
- Hispanic origin (detail)
- Mexican 40%
- Common ancestry
- Lithuanian 1% Romanian 1% Italian 1%
- Foreign-born
- 15% · Canada, China
- Languages at home
- 70% English-only · Spanish 23% Tagalog/Filipino 2% Chinese 1%
Political lean MEDSL · Riverside
- 2024 margin
- Toss-up / Even · D 48.0% · R 49.3% · Other 2.6%
- 2008→2024 swing
- -3.6pp toward R · 2008: 2.3pp · 2024: -1.3pp
- All cycles
- 2024: R+1.3 2020: D+8.0 2016: D+4.3 2012: R+0.4 2008: D+2.3
Not yet ingested
- Civics
- —
Market trends
- HPI YoY
- ▼ -395.13%
- Current HPI
- 373.4608
- Rent YoY
- ▲ 3.85%
- Metro
- Riverside-San Bernardino-Ontario, CA
- State GDP YoY
- ▲ 3.21%
- F500 in state
- 116
Industry mix (Fortune 500 HQ in CA)
| Industry | F500 HQs | Revenue |
|---|---|---|
| Technology | 27 | $1,492B |
|
||
| Financial Services | 3 | $174B |
|
||
| Retail | 3 | $44B |
|
||
| Insurance | 3 | $26B |
|
||
| Media / Entertainment | 2 | $115B |
|
||
| Pharmaceuticals / Biotech | 2 | $62B |
|
||
Price history
+960.0% since first listed10 events — show timeline
- 2026-06-05 Listed $265,000 CRMLS
- 2015-01-29 Sold (MLS) $108,250 CRMLS
- 2015-01-22 Pending — CRMLS
- 2015-01-16 Sold (MLS) $108,250 CRMLS
- 2014-11-26 Contingent — CRMLS
- 2014-11-04 Price Changed $105,000 CRMLS
- 2014-11-04 Price Changed $100,000 CRMLS
- 2014-10-31 Price Changed $110,000 CRMLS
- 2014-10-01 Listed $115,000 CRMLS
- 1986-05-02 Sold (Public Records) $25,000 Public Records
Property tax history
+8.8%/yrLatest (2025): $1,749 · +1.8% YoY. Source: county tax records.
Cash-flow waterfall
monthlySold comps — $/sqft
last 12 mo · ≤1 miLoading sold comps…