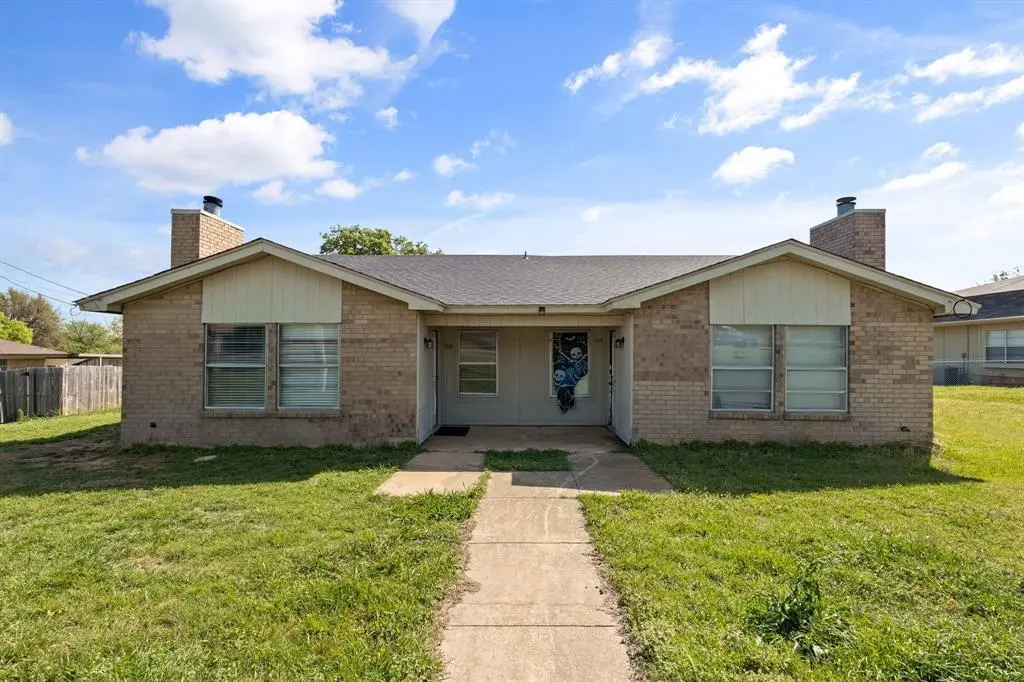
7316 Davis Blvd
North Richland Hills, TX 76182
$349,999D
2 bd · 1.0 ba ·
1,033 sqft ·
Built 1985
· MultiFamily
· Active
· 31 DOM
Cashflow @ list (25.0% down · 7.5%)
Estimated rent
$3,104/mo
Mortgage (P&I)
−$1,835
Tax + insurance
−$462
HOA
−$0
Vac / Maint / Mgmt
−$652
Net cashflow
$155/mo
Annual
$1,859/yr
Cap rate
6.82%
Cash-on-cash
1.90%
DSCR
1.08
1% rule
0.89%
Cash to close
$98,000
Investor read
- This is a 2 × 2-bed/2.0-bath units multifamily listed at $350k.
- At list price, monthly cash flow is $155 ($2k/yr) — positive. Per door: $77/mo.
- The deal already cash-flows at list — no discount required.
- To meet the 1% rule (rent ≥ 1% of price), the offer needs to be $310k (11.3% below list).
- It's been on market 31 days — a 3% lower offer ($339k) is reasonable based on typical stale-listing flexibility.
- Recommended offer: $310k (11.3% below list) — sets the bar for 1% rule.
- Local home prices are declining (-3.0%/yr); year-one equity from $2k of loan paydown is wiped out by about $10k of value loss. Plan a longer hold.
- Location reads 71/100 on livability (#286 in TX) — a middle-class / working-renter tenant base. Strengths: housing A+, cost of living A, employment A-; Watch: amenities F, commute F, health & safety D-.
- Birdville ISD (suburban): math 42% / reading 43% proficiency, ranked #299 of 826 in TX (top 36%) — families likely to look elsewhere, expect single-tenant / working-renter base with shorter leases.
- Zoned schools: Smithfield El (math 44% / reading 58%, grade C-, #818 of 4,322 statewide, top 19%, 610 students, 42% FRL).
- Market conditions: Rents rising (+2.2%/yr); 174 active listings in the ZIP; 8 comparable units currently listed for rent nearby; rentals at typical pace (median 25d on market — plan ~3-4 weeks tenant-placement turnaround); high-income renter base; 18,938 units permitted in Tarrant County in 2024 (8,336 in 5+ unit buildings).
- Tarrant County population projected at +41% by 2050 — long-run rental-demand tailwind backs the buy-and-hold thesis.
- 2 sale attempts since 21y ago; this cycle's ask has dropped $25k (7%) from the opening price — seller is motivated, your offer sets the floor, not the list.
- Climate carrying-cost: extreme-heat days projected 7→23/yr by 2055 (HVAC capex compounding) — expect insurance premiums to compound above CPI over the hold.
- Cap rate 6.8% vs local median 3.6% in North Richland Hills — top-decile yield for the area; either an underpriced asset or a hidden risk that comps aren't pricing in. Stress-test before assuming the spread holds.
- This rent runs 31% of the median local income ($121k/yr) — at the standard rent-burdened threshold; future hikes will face affordability resistance.
Questions for listing agent
- It's been on market 31 days. Have you received any prior offers? Is the seller open to a 11% concession, seller financing, or rate buy-down credit?
- Can we see the unit-by-unit rent roll, current vacancy, and any below-market leases? What's the average tenancy length?
- What capital expenditures (roof, boiler, parking lot, exteriors) have been made in the last 5 years, and what's planned in the next 2?
- Is there a deadline driving the sale (1031 exchange, divorce, estate, relocation)? That informs how much negotiation room exists.
- Schools are B-rated — typically a magnet for longer-tenancy family renters. What's the average tenant stay here, and is there a school-zone premium baked into asking?
- The area grade is low — what's the realistic commute time and amenity access for the typical tenant pool here? Any planned neighborhood developments (good or bad) we should know about?
- What's the average days-on-market for RENTAL listings here right now (not sales)? A rising rental-DOM trend means longer vacancies and softer asking-rent achievability than the comps imply.
- What's the recent tenant-quality profile in this submarket — average credit score on applications, eviction rate, late-payment / NSF rate, and stable-employment percentage? A property-management company in the area should have these aggregated.
CashFlowRE · CFR-9KBZMA2WGGS3SN
· Data 2 days ago
cashflowre.app · 2026-05-29