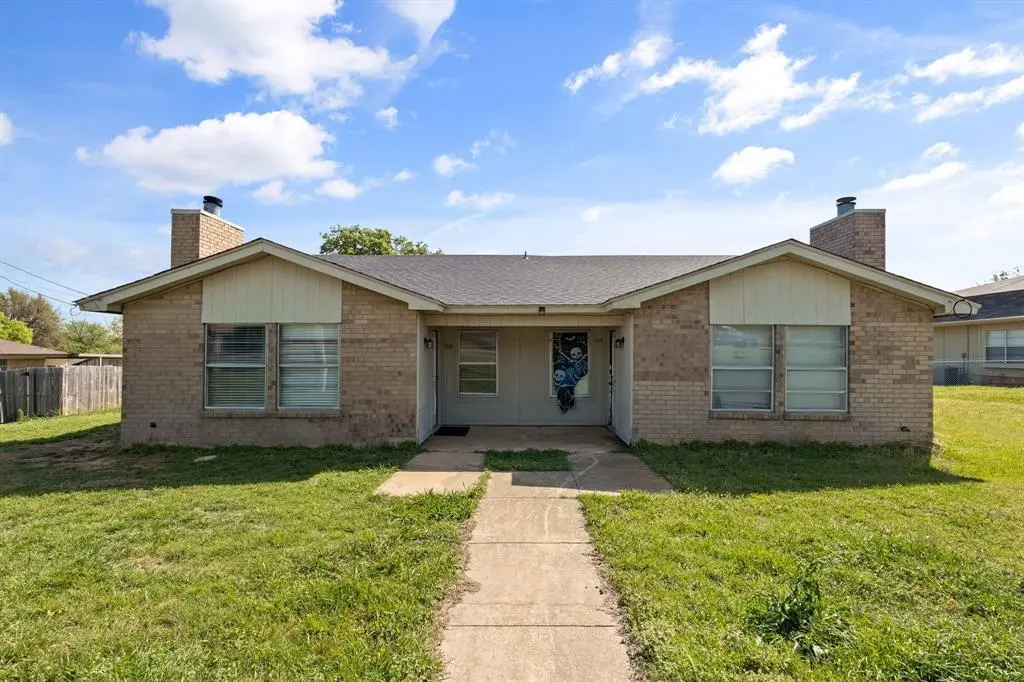
 Duplex
7316 Davis Blvd · North Richland Hills, TX
Flood risk 1/10 · Minimal
- FEMA flood zone
- X (unshaded)
- Chance of flooding over 30 yrs
- 0.0%
- Est. flood insurance / yr
- $507 – $1,088
Fire risk 1/10 · Minimal
- Est. fire insurance / yr
- $1,222 – $2,270
Heat risk 7/10 · Major
- Hot days now (above 109°F)
- 7 days/yr
- Hot days in 30 yrs
- 23 days/yr
Wind risk 4/10 · Minor
- Chance of severe wind over 30 yrs
- 24.0%
Air-quality risk 3/10 · Minor
- Unhealthy air days now
- 3 days/yr
- Unhealthy air days in 30 yrs
- 4 days/yr
Risk factors via First Street. Map © Google.
Why this score? — see what drove the D grade
The composite is a weighted blend of 9 inputs, each scored 0–100. Each bar is that input's sub-score; the figure is the points it added to the 100-point composite (weight × sub-score).
- Cash flow +15.7/30.0
- ARV discount +7.5/15.0
- DSCR +4.8/10.0
- 1% rule +3.9/10.0
- Schools +3.7/10.0
- Livability +3.6/5.0
- Rent growth +3.1/5.0
- Condition / age +2.5/5.0
- Appreciation +0.0/10.0
$349,999
🖨 Deal sheet 📄 Offer letter ✓ Due diligence
Multi-family units
County records classify this as Multi-Family (2-4 Unit). Listing-text estimate: 2 units. confirmed
Listing remarks MLS
BOTH SIDES OF DUPLEX IDENTICAL. BOTH SIDES SOLD TOGETHER, BUT HAVE SEPARATE LEGALS. 2 CAR CARPORTS IN REAR.
Key facts
- Ample cabinetry
- Walk in closets
- Side yard space
Tags
Property features AI
Finance
- Other: Parcel numbers on file; Listing accepts cash, conventional, FHA, VA loan, and 1031 exchange
- Financial info: Designed as residential income with 2 units; Gross annual income/expenses and net operating income reported as 0.00
- HOA & community: No association
Exterior
- Parking: Carport (2 spaces); Covered parking (2 spaces); Driveway; Alley access; Total of 4 parking spaces
- Utilities: City water; City sewer; Electricity connected; No municipal utility district
- Home design: Duplex (residential income); One story; Preowned (built in 1985); Multi-parcel property
- Construction: Brick construction; Composition roof; Slab foundation; Year built 1985
- Exterior features: No fencing; Lot less than 0.5 acre
Interior
- Kitchen: Granite counters
- Bedrooms: 4 bedrooms (single-level home)
- Flooring: Ceramic tile
- Bathrooms: 4 full bathrooms
- Heating & cooling: Central heating; Electric heating; Fireplace heating; Central air; Ceiling fan(s); Electric cooling
- Interior features: Open floorplan; Granite counters; Cable TV available; High-speed internet available; Walk-in closet(s)
- Laundry & utility: Electric water heater
Neighborhood map
What this means for you Summary
Snapshot
- This is a 2 × 2-bed/2.0-bath units multifamily listed at $350k.
Deal economics
- At list price, monthly cash flow is $155 ($2k/yr) — positive. Per door: $77/mo.
- The deal already cash-flows at list — no discount required.
- To meet the 1% rule (rent ≥ 1% of price), the offer needs to be $310k (11.3% below list).
- Recommended offer: $310k (11.3% below list) — sets the bar for 1% rule.
- Cap rate 6.8% vs local median 3.6% in North Richland Hills — top-decile yield for the area; either an underpriced asset or a hidden risk that comps aren't pricing in. Stress-test before assuming the spread holds.
Location & tenants
- Location reads 71/100 on livability (#286 in TX) — a middle-class / working-renter tenant base. Strengths: housing A+, cost of living A, employment A-; Watch: amenities F, commute F, health & safety D-.
- Birdville ISD (suburban): math 42% / reading 43% proficiency, ranked #299 of 826 in TX (top 36%) — families likely to look elsewhere, expect single-tenant / working-renter base with shorter leases.
- Zoned schools: Smithfield El (math 44% / reading 58%, grade C-, #818 of 4,322 statewide, top 19%, 610 students, 42% FRL).
- Market conditions: Rents rising (+2.2%/yr); 174 active listings in the ZIP; 8 comparable units currently listed for rent nearby; rentals at typical pace (median 25d on market — plan ~3-4 weeks tenant-placement turnaround); high-income renter base; 18,938 units permitted in Tarrant County in 2024 (8,336 in 5+ unit buildings).
- This rent runs 31% of the median local income ($121k/yr) — at the standard rent-burdened threshold; future hikes will face affordability resistance.
Forward outlook
- Local home prices are declining (-3.0%/yr); year-one equity from $2k of loan paydown is wiped out by about $10k of value loss. Plan a longer hold.
- Tarrant County population projected at +41% by 2050 — long-run rental-demand tailwind backs the buy-and-hold thesis.
Negotiation context
- It's been on market 31 days — a 3% lower offer ($339k) is reasonable based on typical stale-listing flexibility.
- 2 sale attempts since 21y ago; this cycle's ask has dropped $25k (7%) from the opening price — seller is motivated, your offer sets the floor, not the list.
Risks & watch-outs
- Climate carrying-cost: extreme-heat days projected 7→23/yr by 2055 (HVAC capex compounding) — expect insurance premiums to compound above CPI over the hold.
Questions for the listing agent
- It's been on market 31 days. Have you received any prior offers? Is the seller open to a 11% concession, seller financing, or rate buy-down credit?
- Can we see the unit-by-unit rent roll, current vacancy, and any below-market leases? What's the average tenancy length?
- What capital expenditures (roof, boiler, parking lot, exteriors) have been made in the last 5 years, and what's planned in the next 2?
- Is there a deadline driving the sale (1031 exchange, divorce, estate, relocation)? That informs how much negotiation room exists.
- Schools are B-rated — typically a magnet for longer-tenancy family renters. What's the average tenant stay here, and is there a school-zone premium baked into asking?
- The area grade is low — what's the realistic commute time and amenity access for the typical tenant pool here? Any planned neighborhood developments (good or bad) we should know about?
- What's the average days-on-market for RENTAL listings here right now (not sales)? A rising rental-DOM trend means longer vacancies and softer asking-rent achievability than the comps imply.
- What's the recent tenant-quality profile in this submarket — average credit score on applications, eviction rate, late-payment / NSF rate, and stable-employment percentage? A property-management company in the area should have these aggregated.
- How much new apartment / multifamily construction is in the pipeline within 1–3 miles? Heavy new supply (>2% of stock underway) typically softens rents 12–24 months out; light construction supports rent growth.
Investment metrics
- 1% rule
- 0.89% ✗
- Cap rate
- 6.82%
- Cash-on-cash
- 1.90%
- DSCR
- 1.08
- GRM
- 9.4
CMA / ARV
No comps found within radius.
Projected returns pro-forma
-3.0% appreciation · 2.23% rent growth · sell at horizon
- IRR
- -14.1%
- Equity multiple
- 0.50×
- Total profit
- $-49,261
- Equity at exit
- $52,186
- IRR
- -6.6%
- Equity multiple
- 0.59×
- Total profit
- $-39,943
- Equity at exit
- $30,262
Cash invested: $98,000 (down + closing). Projections, not guarantees.
Landlord ↔ Tenant lean methodology
- Overall (STATE)
- 87 Strongly Landlord-Friendly
- State Texas
- 87 Strongly Landlord-Friendly · R+5
- County
- — inherits STATE
- City
- — inherits STATE
ZIP-level market 76182
- Rents YoY
- 2.2%
- Active inventory
- 174
- Price-to-rent
- 18.8×
Monthly cashflow live
- Estimated rent
- $3,104 medium interval (Pro) →
- Mortgage (P&I)
- −$1,835
- Tax from tax record
- −$316 /mo · $3,791/yr
- Insurance
- −$146
- HOA
- −$0
- Vacancy / Maint / Mgmt
- −$652
- Net cashflow
- $155
Break-even live
2-unit breakdown (identical units grouped — click to expand)
| Units | Beds | Baths | Est. rent |
|---|---|---|---|
| 2× units | 2 | 2 | $3,104 |
| #1 | 2 | 2 | $1,552 |
| #2 | 2 | 2 | $1,552 |
| Total (2 units) | $3,104 | ||
UW: 25.0% down · 7.5% · 30yr · 1.5% tax · 5.0% vac · 8.0% maint · 8.0% mgmt
Financing live
Cash to close
- Down payment
- $87,500
- Closing costs
- $10,500
- Reserves months
- —
- Total cash needed
- —
Loan-product check · same deal, 3 products live
Conventional
25% down · 7.5% · 30yr
- Down + closing
- —
- Monthly P&I
- —
- Monthly cashflow
- —
- DSCR
- —
- Eligible?
- —
Personal DTI + credit; lowest rate.
DSCR
20% down · 8.5% · 30yr
- Down + closing
- —
- Monthly P&I
- —
- Monthly cashflow
- —
- DSCR
- —
- Eligible?
- —
No personal income docs; deal must DSCR.
Hard money
10% down · 12.0% · 12mo
- Down + closing
- —
- Monthly P&I
- —
- Monthly cashflow
- —
- DSCR
- —
- Eligible?
- —
Short-term bridge; refi at stabilization.
Rent comps 8 comps
| Address | Beds | Baths | Sqft | Rent | $/sqft | DOM | Units | Dist |
|---|---|---|---|---|---|---|---|---|
| 7033 Payte Ln North Richland Hills, TX | 3.0 | 1.5 | 1476 | $1,995 | $1.35 | 43d | 1 | 0.55mi |
| 6963 Crabtree Ln North Richland Hills, TX | 3.0 | 2.0 | 1116 | $1,975 | $1.77 | 43d | 1 | 0.59mi |
| 6630 Parkview Ln North Richland Hills, TX | 2.0 | 2.0 | 1059 | $1,650 | $1.56 | 43d | 1 | 1.13mi |
| 7721 Brandi Pl North Richland Hills, TX | 2.0 | 2.0 | 1077 | $1,600 | $1.49 | 24d | 1 | 1.29mi |
| 7761 Sable Ln North Richland Hills, TX | 2.0 | 2.0 | 1077 | $1,600 | $1.49 | 5d | 1 | 1.30mi |
| 6532 Central Ave North Richland Hills, TX | 2.0 | 2.0 | 1059 | $1,800 | $1.70 | 17d | 1 | 1.32mi |
| 7704 Jennifer Ln North Richland Hills, TX | 2.0 | 2.0 | 1080 | $1,495 | $1.38 | 20d | 1 | 1.40mi |
| 7614 April Ct North Richland Hills, TX | 3.0 | 2.0 | 1400 | $1,950 | $1.39 | 14d | 1 | 1.48mi |
Listing history 17 events
-
2026-06-18days on market $349,999 Active 31 DOM
-
2026-06-17days on market $349,999 Active 30 DOM
-
2026-06-16days on market $349,999 Active 29 DOM
-
2026-06-15days on market $349,999 Active 28 DOM
-
2026-06-13days on market $349,999 Active 26 DOM
-
2026-06-09days on market $349,999 Active 22 DOM
-
2026-06-08days on market $349,999 Active 21 DOM
-
2026-06-07days on market $349,999 Active 20 DOM
-
2026-06-04days on market $349,999 Active 17 DOM
-
2026-06-03days on market $349,999 Active 16 DOM
-
2026-06-02pricedays on market $349,999 Active 15 DOM
-
2026-06-01days on market $375,000 Active 14 DOM
-
2026-05-31days on market $375,000 Active 13 DOM
-
2026-05-18$375,000 Active
-
2005-10-28soldstatus 107-char remark
Show marketing remark (107 chars)
BOTH SIDES OF DUPLEX IDENTICAL. BOTH SIDES SOLD TOGETHER, BUT HAVE SEPARATE LEGALS. 2 CAR CARPORTS IN REAR.
-
2005-09-27historical 107-char remark
Show marketing remark (107 chars)
BOTH SIDES OF DUPLEX IDENTICAL. BOTH SIDES SOLD TOGETHER, BUT HAVE SEPARATE LEGALS. 2 CAR CARPORTS IN REAR.
-
2005-09-14$137,800 107-char remark
Show marketing remark (107 chars)
BOTH SIDES OF DUPLEX IDENTICAL. BOTH SIDES SOLD TOGETHER, BUT HAVE SEPARATE LEGALS. 2 CAR CARPORTS IN REAR.
ⓘ Source: listings_history table (triggers on properties + properties_extension) + one-shot
backfill from property_details.listing_events for pre-trigger history.
Tax reassessment forecast TX · Resets to sale price
- Current annual tax
- $3,791 · $316/mo
- Projected year-2 tax
- $6,405 · $534/mo
- Expected delta
- +$2,614/yr (+$218/mo · 68.9%)
ⓘ Screening estimate from a state-policy table — verify with the county assessor before closing.
Climate risk First Street
- Flood 1/10 Low FEMA zone X (unshaded) · 0% chance over 30 yrs
- Wildfire 1/10 Low
- Heat 7/10 Severe 7 d/yr ≥109°F today · 23 d/yr by 30 yrs out
- Wind 4/10 Moderate 24% chance of damaging wind over 30 yrs
- Air quality 3/10 Moderate 3 unhealthy d/yr today · 4 by 30 yrs out
Nearby sold comps map
Loading sold comps map…
Walkable amenities ~0.75 mi
Loading nearby amenities…
Taxation est. · year 1
- Rental income
- $37,248
- − Mortgage interest
- −$19,605
- − Property taxes
- −$3,791
- − Insurance
- −$1,750
- − Repairs & maintenance
- −$2,980
- − Management
- −$2,980
- − Depreciation
- −$10,182
- Taxable loss
- −$4,040
- Est. tax savings @ 24.0%
- +$970
- After-tax cash flow
- $2,829/yr
For passive investors: Depreciation is non-cash, so a rental often shows a tax loss while cash-flowing — sheltering income. Rental losses are passive: they offset passive income freely, and up to $25,000/yr can offset ordinary (W-2) income if you actively participate and your MAGI is under $100k (phasing out to $0 by $150k); unused losses carry forward. On sale, claimed depreciation is recaptured at up to 25%, and gains may owe capital-gains tax (a 1031 exchange can defer both). Figures are a year-1 estimate at your 24.0% rate — not tax advice; consult a CPA.
Schools (NCES district)
- District
- Birdville ISD
- NCES district ID
- 4810230
- Math proficiency
- 42% ▼ -12.00%
- Reading proficiency
- 43% ▼ -6.00%
- Median HH income
- $55,930
- Composite
- 37.13/100
- National rank
- #4491
- State rank
- #299 of 826 in TX
Livability — North Richland Hills
- Score
- 71/100
- State rank
- #286
- US rank
- #6602
Category grades
Schools grade is shown separately in the Schools card above.
Census & demographics
- Census place
- North Richland Hills, TX
- County
- Tarrant County · 2,033,669 people
- City population
- 68,613
- Metro
- Dallas-Fort Worth-Arlington, TX
- Population (ZIP)
- 30,242
- Household income
- $120,558
- Rent vs Own
- Severe rent burden
- 284.0
Population outlook (Tarrant County) Hauer SSP2
- Today (2025)
- 2,380,417 people
- By 2030
- 2,578,900 · +8.3%
- By 2040
- 2,974,995 · +25.0%
- By 2050
- 3,350,489 · +40.8%
- By 2075
- 4,216,909 · +77.2%
- By 2100
- 4,741,527 · +99.2%
Race, ethnicity, and origin ACS 2023
- Neighborhood character
- Predominantly White (74%)
- Race & ethnicity
- White 74% Hispanic / Latino 15% Two or more races 10% Asian 4% Black 4%
- Hispanic origin (detail)
- Mexican 10% Puerto Rican 1%
- Common ancestry
- Lithuanian 3% Slovak 3% Italian 3%
- Foreign-born
- 8% · Canada, Vietnam, Jamaica
- Languages at home
- 87% English-only · Spanish 8% Arabic 1% Other Indo-European 1%
Political lean MEDSL · Tarrant
- 2024 margin
- Lean R (+5.1) · D 46.7% · R 51.9% · Other 1.4%
- 2008→2024 swing
- +6.6pp toward D · 2008: -11.7pp · 2024: -5.1pp
- All cycles
- 2024: R+5.1 2020: D+0.2 2016: R+8.7 2012: R+15.7 2008: R+11.7
Not yet ingested
- Civics
- —
Market trends
- HPI YoY
- ▼ -168.20%
- Current HPI
- 277.0162
- Rent YoY
- ▲ 2.23%
- Metro
- Dallas-Fort Worth-Arlington, TX
- State GDP YoY
- ▲ 3.95%
- F500 in state
- 110
Industry mix (Fortune 500 HQ in TX)
| Industry | F500 HQs | Revenue |
|---|---|---|
| Energy | 16 | $1,198B |
|
||
| Technology | 5 | $198B |
|
||
| Engineering / Construction | 4 | $72B |
|
||
| Energy Services | 3 | $60B |
|
||
| Utilities | 3 | $41B |
|
||
| Healthcare | 2 | $330B |
|
||
Price history
+172.1% since first listed4 events — show timeline
- 2026-05-18 Listed $375,000 NTREIS
- 2005-10-28 Sold (MLS) — NTREIS
- 2005-09-27 Listing Removed — NTREIS
- 2005-09-14 Listed $137,800 NTREIS
Property tax history
+5.8%/yrLatest (2025): $3,791 · -6.0% YoY. Source: county tax records.
Cash-flow waterfall
monthlySold comps — $/sqft
last 12 mo · ≤1 miLoading sold comps…