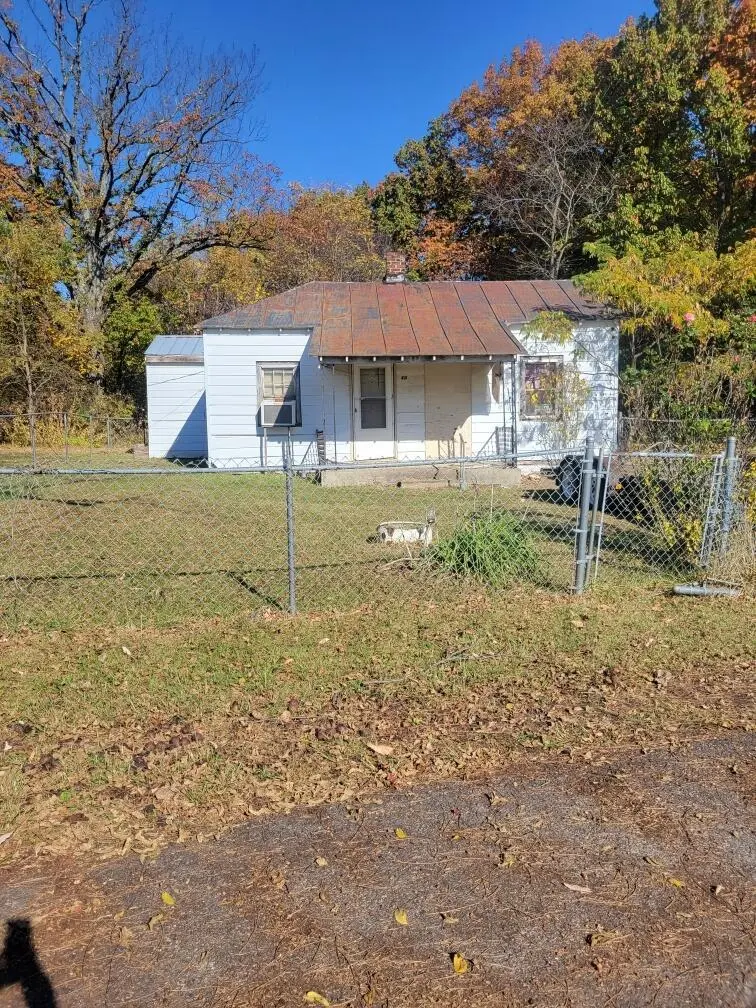
450 Byrd Ln
Rocky Mount, VA 24151
$32,800B
1 bd · 1.0 ba ·
652 sqft ·
Built 1920
· SingleFamily
· Pending
Cashflow @ list (25.0% down · 7.5%)
Estimated rent
$925/mo
Mortgage (P&I)
−$172
Tax + insurance
−$31
HOA
−$0
Vac / Maint / Mgmt
−$194
Net cashflow
$527/mo
Annual
$6,329/yr
Cap rate
25.59%
Cash-on-cash
68.91%
DSCR
4.07
1% rule
2.82%
Cash to close
$9,184
Investor read
- This is a 1-bed/1.0-bath single-family listed at $33k.
- At list price, monthly cash flow is $527 ($6k/yr) — positive.
- The deal already cash-flows at list — no discount required.
- Meets the 1% rule at list price ($925 rent vs $33k).
- Only 0 days on market — expect competitive offers; lowballing is unlikely to land.
- Local home prices are declining (-3.0%/yr); year-one equity from $227 of loan paydown is wiped out by about $984 of value loss. Plan a longer hold.
- Location reads 74/100 on livability (#153 in VA, #4,873 nationally) — a middle-class / working-renter tenant base. Strengths: cost of living A+, housing A+, health & safety A-; Watch: amenities F, commute F, employment F.
- Franklin County Public School District (town): math 69% / reading 72% proficiency, ranked #24 of 131 in VA (top 18%) — strong family-tenant draw, lease renewals of 3-5y typical.
- Zoned schools: Rocky Mount Elementary (math 67% / reading 52%, grade B-, #536 of 1,108 statewide, top 51%, 290 students, 76% FRL); Benjamin Franklin Middle (math 64% / reading 72%, grade A-, #94 of 342 statewide, top 28%, 1,397 students, 74% FRL); Franklin County High (math 79% / reading 82%, grade A, #57 of 319 statewide, top 18%, 1,904 students, 74% FRL) — zoned schools average 75% FRL vs 45% district-wide (30 pts higher); higher-poverty schools than district average — tighter screening recommended.
- Watch-outs: built in 1920 — expect roof / HVAC / electrical / plumbing capex.
- Market conditions: 193 active listings in the ZIP; 1 comparable units currently listed for rent nearby; 167 units permitted in Franklin County in 2024 (10 in 5+ unit buildings).
- Franklin County population projected at -11% by 2050 — secular population decline; favor cash flow + early exit over multi-decade hold.
- At projected returns (-3.0% appreciation + 3.0% rent growth), your $9k cash investment doubles in ~2 years — after that, you're playing with house money.
- Cap rate 25.6% vs local median 2.7% in Rocky Mount — top-decile yield for the area; either an underpriced asset or a hidden risk that comps aren't pricing in. Stress-test before assuming the spread holds.
- This rent is only 17% of the median local income ($65k/yr) — well below the 30% rent-burden line; pricing power to push rent on renewal without tenant pushback.
Questions for listing agent
- Built in 1920 — when were the roof, HVAC, electrical panel, plumbing, and water heater last replaced?
- Is there a deadline driving the sale (1031 exchange, divorce, estate, relocation)? That informs how much negotiation room exists.
- Schools are A-rated — typically a magnet for longer-tenancy family renters. What's the average tenant stay here, and is there a school-zone premium baked into asking?
- What's the average days-on-market for RENTAL listings here right now (not sales)? A rising rental-DOM trend means longer vacancies and softer asking-rent achievability than the comps imply.
- What's the recent tenant-quality profile in this submarket — average credit score on applications, eviction rate, late-payment / NSF rate, and stable-employment percentage? A property-management company in the area should have these aggregated.
- How much new for-sale + rental construction is in the pipeline within 1–3 miles? Heavy new supply typically softens prices + rents 12–24 months out; constrained supply supports both.
CashFlowRE · CFR-9M4XDQCREZX7VE
· Data 3 weeks ago
cashflowre.app · 2026-05-29