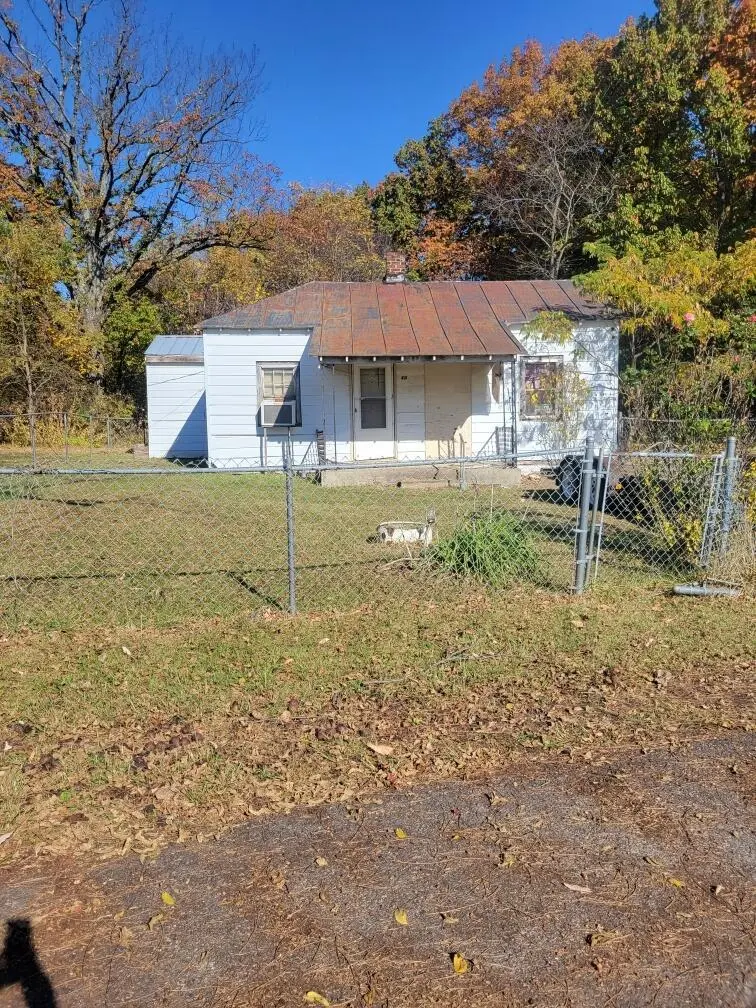
450 Byrd Ln · Rocky Mount, VA
Flood risk 1/10 · Minimal
- FEMA flood zone
- X (unshaded)
- Chance of flooding over 30 yrs
- 0.0%
- Est. flood insurance / yr
- $507 – $1,088
Fire risk 3/10 · Minor
- Est. fire insurance / yr
- $666 – $1,236
Heat risk 4/10 · Minor
- Hot days now (above 100°F)
- 7 days/yr
- Hot days in 30 yrs
- 18 days/yr
Wind risk 2/10 · Minimal
- Chance of severe wind over 30 yrs
- 3.0%
Air-quality risk 2/10 · Minimal
- Unhealthy air days now
- 0 days/yr
- Unhealthy air days in 30 yrs
- 1 days/yr
Risk factors via First Street. Map © Google.
Why this score? — see what drove the B grade
The composite is a weighted blend of 9 inputs, each scored 0–100. Each bar is that input's sub-score; the figure is the points it added to the 100-point composite (weight × sub-score).
- Cash flow +30.0/30.0
- 1% rule +10.0/10.0
- DSCR +10.0/10.0
- ARV discount +7.5/15.0
- Schools +6.0/10.0
- Livability +3.7/5.0
- Rent growth +2.5/5.0
- Condition / age +2.5/5.0
- Appreciation +0.0/10.0
$32,800
🖨 Deal sheet 📄 Offer letter ✓ Due diligence
Listing remarks
A great opportunity for a handyman! Will need to be completely renovated/rebuilt but located on a full, partially cleared, mostly level, 1 acre lot. Public water & sewer. Sold as-is, where-is. Seller will not be clearing out anything remaining in the home. Be very careful when entering the residence, enter with caution. There is no current heat source. Trailer does not convey and will be removed by the seller.
Key facts
- 0.28 acre lot
- Built 1920
Neighborhood map
What this means for you Summary
Snapshot
- This is a 1-bed/1.0-bath single-family listed at $33k.
Deal economics
- At list price, monthly cash flow is $527 ($6k/yr) — positive.
- The deal already cash-flows at list — no discount required.
- Meets the 1% rule at list price ($925 rent vs $33k).
- Cap rate 25.6% vs local median 2.7% in Rocky Mount — top-decile yield for the area; either an underpriced asset or a hidden risk that comps aren't pricing in. Stress-test before assuming the spread holds.
Location & tenants
- Location reads 74/100 on livability (#153 in VA, #4,873 nationally) — a middle-class / working-renter tenant base. Strengths: cost of living A+, housing A+, health & safety A-; Watch: amenities F, commute F, employment F.
- Franklin County Public School District (town): math 69% / reading 72% proficiency, ranked #24 of 131 in VA (top 18%) — strong family-tenant draw, lease renewals of 3-5y typical.
- Zoned schools: Rocky Mount Elementary (math 67% / reading 52%, grade B-, #536 of 1,108 statewide, top 51%, 290 students, 76% FRL); Benjamin Franklin Middle (math 64% / reading 72%, grade A-, #94 of 342 statewide, top 28%, 1,397 students, 74% FRL); Franklin County High (math 79% / reading 82%, grade A, #57 of 319 statewide, top 18%, 1,904 students, 74% FRL) — zoned schools average 75% FRL vs 45% district-wide (30 pts higher); higher-poverty schools than district average — tighter screening recommended.
- Market conditions: 193 active listings in the ZIP; 1 comparable units currently listed for rent nearby; 167 units permitted in Franklin County in 2024 (10 in 5+ unit buildings).
- This rent is only 17% of the median local income ($65k/yr) — well below the 30% rent-burden line; pricing power to push rent on renewal without tenant pushback.
Forward outlook
- Local home prices are declining (-3.0%/yr); year-one equity from $227 of loan paydown is wiped out by about $984 of value loss. Plan a longer hold.
- Franklin County population projected at -11% by 2050 — secular population decline; favor cash flow + early exit over multi-decade hold.
- At projected returns (-3.0% appreciation + 3.0% rent growth), your $9k cash investment doubles in ~2 years — after that, you're playing with house money.
Negotiation context
- Only 0 days on market — expect competitive offers; lowballing is unlikely to land.
Risks & watch-outs
- Watch-outs: built in 1920 — expect roof / HVAC / electrical / plumbing capex.
Questions for the listing agent
- Built in 1920 — when were the roof, HVAC, electrical panel, plumbing, and water heater last replaced?
- Is there a deadline driving the sale (1031 exchange, divorce, estate, relocation)? That informs how much negotiation room exists.
- Schools are A-rated — typically a magnet for longer-tenancy family renters. What's the average tenant stay here, and is there a school-zone premium baked into asking?
- What's the average days-on-market for RENTAL listings here right now (not sales)? A rising rental-DOM trend means longer vacancies and softer asking-rent achievability than the comps imply.
- What's the recent tenant-quality profile in this submarket — average credit score on applications, eviction rate, late-payment / NSF rate, and stable-employment percentage? A property-management company in the area should have these aggregated.
- How much new for-sale + rental construction is in the pipeline within 1–3 miles? Heavy new supply typically softens prices + rents 12–24 months out; constrained supply supports both.
Investment metrics
- 1% rule
- 2.82% ✓
- Cap rate
- 25.59%
- Cash-on-cash
- 68.91%
- DSCR
- 4.07
- GRM
- 3.0
CMA / ARV
No comps found within radius.
Projected returns pro-forma
-3.0% appreciation · 3.0% rent growth · sell at horizon
- IRR
- 68.4%
- Equity multiple
- 4.08×
- Total profit
- $28,276
- Equity at exit
- $4,891
- IRR
- 72.5%
- Equity multiple
- 8.39×
- Total profit
- $67,874
- Equity at exit
- $2,836
Cash invested: $9,184 (down + closing). Projections, not guarantees.
Landlord ↔ Tenant lean methodology
- Overall (STATE)
- 55 Moderately Landlord-Leaning
- State Virginia
- 55 Moderately Landlord-Leaning · D+2
- County
- — inherits STATE
- City
- — inherits STATE
ZIP-level market 24151
- Home prices YoY
- -13.4%
- Active inventory
- 193
- Price-to-rent
- 3.0×
Monthly cashflow live
- Estimated rent
- $925 medium interval (Pro) →
- Mortgage (P&I)
- −$172
- Tax from tax record
- −$17 /mo · $210/yr
- Insurance
- −$14
- HOA
- −$0
- Vacancy / Maint / Mgmt
- −$194
- Net cashflow
- $527
Break-even live
UW: 25.0% down · 7.5% · 30yr · 1.5% tax · 5.0% vac · 8.0% maint · 8.0% mgmt
Financing live
Cash to close
- Down payment
- $8,200
- Closing costs
- $984
- Reserves months
- —
- Total cash needed
- —
Loan-product check · same deal, 3 products live
Conventional
25% down · 7.5% · 30yr
- Down + closing
- —
- Monthly P&I
- —
- Monthly cashflow
- —
- DSCR
- —
- Eligible?
- —
Personal DTI + credit; lowest rate.
DSCR
20% down · 8.5% · 30yr
- Down + closing
- —
- Monthly P&I
- —
- Monthly cashflow
- —
- DSCR
- —
- Eligible?
- —
No personal income docs; deal must DSCR.
Hard money
10% down · 12.0% · 12mo
- Down + closing
- —
- Monthly P&I
- —
- Monthly cashflow
- —
- DSCR
- —
- Eligible?
- —
Short-term bridge; refi at stabilization.
Rent comps 1 comps
| Address | Beds | Baths | Sqft | Rent | $/sqft | DOM | Units | Dist |
|---|---|---|---|---|---|---|---|---|
| 85 Wilson St Rocky Mount, VA | 2.0 | 1.0 | 700 | $900 | $1.29 | 44d | 1 | 1.06mi |
Listing history 3 events
-
2023-11-11status Pending
-
2023-11-08price $32,800
-
2023-11-01$48,900 Active
ⓘ Source: listings_history table (triggers on properties + properties_extension) + one-shot
backfill from property_details.listing_events for pre-trigger history.
Tax reassessment forecast VA · Resets to sale price
- Current annual tax
- $210 · $17/mo
- Projected year-2 tax
- $269 · $22/mo
- Expected delta
- +$59/yr (+$5/mo · 28.2%)
ⓘ Screening estimate from a state-policy table — verify with the county assessor before closing.
Climate risk First Street
- Flood 1/10 Low FEMA zone X (unshaded) · 0% chance over 30 yrs
- Wildfire 3/10 Moderate
- Heat 4/10 Moderate 7 d/yr ≥100°F today · 18 d/yr by 30 yrs out
- Wind 2/10 Low 3% chance of damaging wind over 30 yrs
- Air quality 2/10 Low 0 unhealthy d/yr today · 1 by 30 yrs out
Nearby sold comps map
Loading sold comps map…
Walkable amenities ~0.75 mi
Loading nearby amenities…
Taxation est. · year 1
- Rental income
- $11,097
- − Mortgage interest
- −$1,837
- − Property taxes
- −$210
- − Insurance
- −$164
- − Repairs & maintenance
- −$888
- − Management
- −$888
- − Depreciation
- −$954
- Taxable income
- $6,156
- Est. tax owed @ 24.0%
- −$1,478
- After-tax cash flow
- $4,851/yr
For passive investors: Depreciation is non-cash, so a rental often shows a tax loss while cash-flowing — sheltering income. Rental losses are passive: they offset passive income freely, and up to $25,000/yr can offset ordinary (W-2) income if you actively participate and your MAGI is under $100k (phasing out to $0 by $150k); unused losses carry forward. On sale, claimed depreciation is recaptured at up to 25%, and gains may owe capital-gains tax (a 1031 exchange can defer both). Figures are a year-1 estimate at your 24.0% rate — not tax advice; consult a CPA.
Schools (NCES district)
- District
- Franklin County Public School District
- NCES district ID
- 5101440
- Math proficiency
- 69% ▼ -17.00%
- Reading proficiency
- 72% ▼ -8.00%
- Median HH income
- $47,093
- Composite
- 59.5/100
- National rank
- #921
- State rank
- #24 of 131 in VA
Livability — Rocky Mount
- Score
- 74/100
- State rank
- #153
- US rank
- #4873
Category grades
Schools grade is shown separately in the Schools card above.
Census & demographics
- Census place
- Rocky Mount, VA
- County
- Franklin County · 18,154 people
- City population
- 18,154
- Metro
- Roanoke, VA
- Population (ZIP)
- 18,154
- Household income
- $65,223
- Rent vs Own
- Severe rent burden
- 462.0
Population outlook (Franklin County) Hauer SSP2
- Today (2025)
- 56,242 people
- By 2030
- 55,742 · -0.9%
- By 2040
- 53,669 · -4.6%
- By 2050
- 50,291 · -10.6%
- By 2075
- 42,395 · -24.6%
- By 2100
- 32,981 · -41.4%
Race, ethnicity, and origin ACS 2023
- Neighborhood character
- Predominantly White (78%)
- Race & ethnicity
- White 78% Black 14% Two or more races 5% Hispanic / Latino 4%
- Common ancestry
- Lithuanian 2% Serbian 1% Slovak 1%
- Foreign-born
- 3% · Canada
- Languages at home
- 95% English-only · Spanish 3% Arabic 1%
Political lean MEDSL · Franklin
- 2024 margin
- Solid R (+45.3) · D 26.9% · R 72.2%
- 2008→2024 swing
- -22.5pp toward R · 2008: -22.8pp · 2024: -45.3pp
- All cycles
- 2024: R+45.3 2020: R+42.1 2016: R+42.2 2012: R+28.6 2008: R+22.8
Not yet ingested
- Civics
- —
Market trends
- HPI YoY
- ▼ -31.83%
- Current HPI
- 204.9607
- Rent YoY
- —
- Metro
- Roanoke, VA
- State GDP YoY
- ▲ 2.40%
- F500 in state
- 50
Industry mix (Fortune 500 HQ in VA)
| Industry | F500 HQs | Revenue |
|---|---|---|
| Aerospace / Defense | 4 | $236B |
|
||
| Technology / Defense | 3 | $32B |
|
||
| Financial Services | 2 | $176B |
|
||
| Utilities | 2 | $27B |
|
||
| Insurance | 2 | $25B |
|
||
| Technology | 2 | $15B |
|
||
Price history
-32.9% since first listed3 events — show timeline
- 2023-11-11 Pending — MLSRV
- 2023-11-08 Price Changed $32,800 MLSRV
- 2023-11-01 Listed $48,900 MLSRV
Property tax history
+2.1%/yrLatest (2025): $210 · +0.0% YoY. Source: county tax records.
Cash-flow waterfall
monthlySold comps — $/sqft
last 12 mo · ≤1 miLoading sold comps…