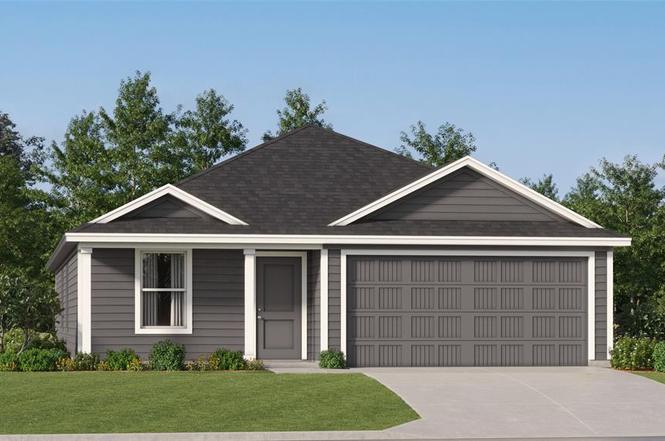
2532 Smoke Passage St
Heartland, TX 75114
$223,999D+
4 bd · 2.0 ba ·
1,667 sqft ·
Built 2025
· Land
· Pending
· 38 DOM
Cashflow @ list (25.0% down · 7.5%)
Estimated rent
$2,075/mo
Mortgage (P&I)
−$1,175
Tax + insurance
−$253
HOA
−$42
Vac / Maint / Mgmt
−$436
Net cashflow
$170/mo
Annual
$2,041/yr
Cap rate
7.20%
Cash-on-cash
3.25%
DSCR
1.14
1% rule
0.93%
Cash to close
$62,720
Investor read
- This is a 4-bed/2.0-bath land listed at $224k.
- At list price, monthly cash flow is $170 ($2k/yr) — positive.
- The deal already cash-flows at list — no discount required.
- To meet the 1% rule (rent ≥ 1% of price), the offer needs to be $208k (7.3% below list).
- It's been on market 38 days — a 3% lower offer ($217k) is reasonable based on typical stale-listing flexibility.
- Recommended offer: $208k (7.3% below list) — sets the bar for 1% rule.
- Local home prices are declining (-3.0%/yr); year-one equity from $2k of loan paydown is wiped out by about $7k of value loss. Plan a longer hold.
- Location reads: area grade D — affects rentability + tenant quality, not the cash-flow math above.
- Crandall ISD (rural): math 36% / reading 42% proficiency, ranked #351 of 826 in TX (top 42%) — families likely to look elsewhere, expect single-tenant / working-renter base with shorter leases.
- Zoned schools: W A Martin El (math 41% / reading 32%, grade F, #1,883 of 4,322 statewide, top 44%, 644 students, 71% FRL); Crandall Middle (math 38% / reading 42%, grade F, #646 of 1,662 statewide, top 40%, 983 students, 60% FRL); Crandall H S (math 33% / reading 53%, grade F, #713 of 1,632 statewide, top 44%, 1,707 students, 56% FRL) — zoned schools average 62% FRL vs 41% district-wide (21 pts higher); higher-poverty schools than district average — tighter screening recommended.
- Market conditions: 802 active listings in the ZIP; 40 comparable units currently listed for rent nearby; rentals at typical pace (median 27d on market — plan ~3-4 weeks tenant-placement turnaround); solid renter incomes; 1,747 units permitted in Kaufman County in 2024 (180 in 5+ unit buildings).
- Kaufman County population projected at +43% by 2050 — long-run rental-demand tailwind backs the buy-and-hold thesis.
- Cap rate 7.2% vs local median 4.6% in Heartland — top-decile yield for the area; either an underpriced asset or a hidden risk that comps aren't pricing in. Stress-test before assuming the spread holds.
Questions for listing agent
- It's been on market 38 days. Have you received any prior offers? Is the seller open to a 7% concession, seller financing, or rate buy-down credit?
- What does the HOA fee cover, when was the last increase, and are there any pending special assessments or reserve-fund shortfalls?
- Is there a deadline driving the sale (1031 exchange, divorce, estate, relocation)? That informs how much negotiation room exists.
- The area grade is low — what's the realistic commute time and amenity access for the typical tenant pool here? Any planned neighborhood developments (good or bad) we should know about?
- What's the average days-on-market for RENTAL listings here right now (not sales)? A rising rental-DOM trend means longer vacancies and softer asking-rent achievability than the comps imply.
- What's the recent tenant-quality profile in this submarket — average credit score on applications, eviction rate, late-payment / NSF rate, and stable-employment percentage? A property-management company in the area should have these aggregated.
- How much new for-sale + rental construction is in the pipeline within 1–3 miles? Heavy new supply typically softens prices + rents 12–24 months out; constrained supply supports both.
CashFlowRE · CFR-9PMREM6B0NE38K
· Data 1 week ago
cashflowre.app · 2026-05-29