2532 Smoke Passage St · Heartland, TX
Flood risk No data
- FEMA flood zone
- —
- Chance of flooding over 30 yrs
- —
- Est. flood insurance / yr
- —
Fire risk No data
- Est. fire insurance / yr
- —
Heat risk No data
- Hot days now (above threshold)
- —
- Hot days in 30 yrs
- —
Wind risk No data
- Chance of severe wind over 30 yrs
- —
Air-quality risk No data
- Unhealthy air days now
- —
- Unhealthy air days in 30 yrs
- —
Risk factors via First Street. Map © Google.
Why this score? — see what drove the D+ grade
The composite is a weighted blend of 9 inputs, each scored 0–100. Each bar is that input's sub-score; the figure is the points it added to the 100-point composite (weight × sub-score).
- Cash flow +17.4/30.0
- ARV discount +7.5/15.0
- DSCR +5.4/10.0
- 1% rule +4.3/10.0
- Schools +3.6/10.0
- Rent growth +2.5/5.0
- Livability +2.5/5.0
- Condition / age +2.5/5.0
- Appreciation +0.0/10.0
$223,999
🖨 Deal sheet (PDF) 📄 Offer letter ✓ Due diligence
Listing remarks
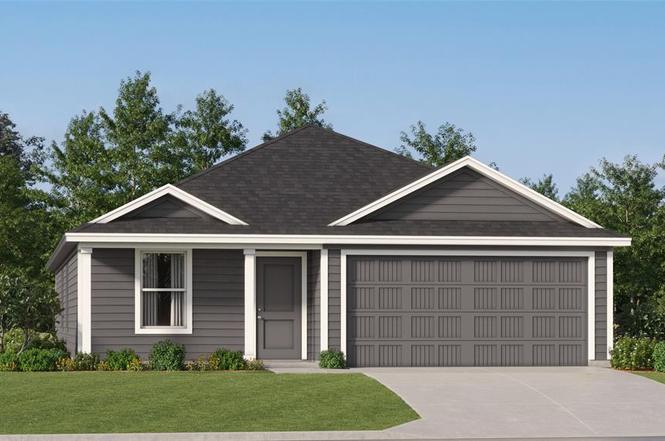
LENNAR - Eastland - Ramsey Floorplan - This new single-story design makes smart use of the space available. At the front are all three secondary bedrooms arranged near a convenient full-sized bathroom. Down the foyer is a modern layout connecting a peninsula-style kitchen made for inspired meals, an intimate dining area and a family room ideal for gatherings. Tucked in a quiet corner is the owner’s suite with an attached bathroom and walk-in closet. Prices and features may vary and are subject to change. Photos are for illustrative purposes only.
Key facts
- Intimate dining area
- Walk-in closet
- Single-story design
Tags
Neighborhood map
What this means for you Summary
Snapshot
- This is a 4-bed/2.0-bath land listed at $224k.
Deal economics
- At list price, monthly cash flow is $170 ($2k/yr) — positive.
- The deal already cash-flows at list — no discount required.
- To meet the 1% rule (rent ≥ 1% of price), the offer needs to be $208k (7.3% below list).
- Recommended offer: $208k (7.3% below list) — sets the bar for 1% rule.
- Cap rate 7.2% vs local median 4.6% in Heartland — top-decile yield for the area; either an underpriced asset or a hidden risk that comps aren't pricing in. Stress-test before assuming the spread holds.
Location & tenants
- Location reads: area grade D — affects rentability + tenant quality, not the cash-flow math above.
- Crandall ISD (rural): math 36% / reading 42% proficiency, ranked #351 of 826 in TX (top 42%) — families likely to look elsewhere, expect single-tenant / working-renter base with shorter leases.
- Zoned schools: W A Martin El (math 41% / reading 32%, grade F, #1,883 of 4,322 statewide, top 44%, 644 students, 71% FRL); Crandall Middle (math 38% / reading 42%, grade F, #646 of 1,662 statewide, top 40%, 983 students, 60% FRL); Crandall H S (math 33% / reading 53%, grade F, #713 of 1,632 statewide, top 44%, 1,707 students, 56% FRL) — zoned schools average 62% FRL vs 41% district-wide (21 pts higher); higher-poverty schools than district average — tighter screening recommended.
- Market conditions: 802 active listings in the ZIP; 40 comparable units currently listed for rent nearby; rentals at typical pace (median 27d on market — plan ~3-4 weeks tenant-placement turnaround); solid renter incomes; 1,747 units permitted in Kaufman County in 2024 (180 in 5+ unit buildings).
Forward outlook
- Local home prices are declining (-3.0%/yr); year-one equity from $2k of loan paydown is wiped out by about $7k of value loss. Plan a longer hold.
- Kaufman County population projected at +43% by 2050 — long-run rental-demand tailwind backs the buy-and-hold thesis.
Negotiation context
- It's been on market 38 days — a 3% lower offer ($217k) is reasonable based on typical stale-listing flexibility.
Questions for the listing agent
- It's been on market 38 days. Have you received any prior offers? Is the seller open to a 7% concession, seller financing, or rate buy-down credit?
- What does the HOA fee cover, when was the last increase, and are there any pending special assessments or reserve-fund shortfalls?
- Is there a deadline driving the sale (1031 exchange, divorce, estate, relocation)? That informs how much negotiation room exists.
- The area grade is low — what's the realistic commute time and amenity access for the typical tenant pool here? Any planned neighborhood developments (good or bad) we should know about?
- What's the average days-on-market for RENTAL listings here right now (not sales)? A rising rental-DOM trend means longer vacancies and softer asking-rent achievability than the comps imply.
- What's the recent tenant-quality profile in this submarket — average credit score on applications, eviction rate, late-payment / NSF rate, and stable-employment percentage? A property-management company in the area should have these aggregated.
- How much new for-sale + rental construction is in the pipeline within 1–3 miles? Heavy new supply typically softens prices + rents 12–24 months out; constrained supply supports both.
Investment metrics
- 1% rule
- 0.93% ✗
- Cap rate
- 7.20%
- Cash-on-cash
- 3.25%
- DSCR
- 1.14
- GRM
- 9.0
CMA / ARV
No comps found within radius.
Projected returns pro-forma
-3.0% appreciation · 3.0% rent growth · sell at horizon
- IRR
- -11.2%
- Equity multiple
- 0.59×
- Total profit
- $-25,484
- Equity at exit
- $33,399
- IRR
- -2.0%
- Equity multiple
- 0.87×
- Total profit
- $-8,313
- Equity at exit
- $19,367
Cash invested: $62,720 (down + closing). Projections, not guarantees.
Landlord ↔ Tenant lean methodology
- Overall (STATE)
- 87 Strongly Landlord-Friendly
- State Texas
- 87 Strongly Landlord-Friendly · R+5
- County
- — inherits STATE
- City
- — inherits STATE
ZIP-level market 75114
- Home prices YoY
- -26.7%
- Active inventory
- 802
- Price-to-rent
- 9.0×
Monthly cashflow live
- Estimated rent
- $2,075 high interval (Pro) →
- Mortgage (P&I)
- −$1,175
- Tax from tax record
- −$160 /mo · $1,915/yr
- Insurance
- −$93
- HOA
- −$42
- Vacancy / Maint / Mgmt
- −$436
- Net cashflow
- $170
Break-even live
Sensitivity live
| Price | -10% $297 | -5% $233 | +0% $170 | +5% $107 | +10% $43 |
|---|---|---|---|---|---|
| Rent | -10% $6 | -5% $88 | +0% $170 | +5% $252 | +10% $334 |
| Rate | -1.0pp $283 | -0.5pp $227 | base $170 | +0.5pp $112 | +1.0pp $53 |
UW: 25.0% down · 7.5% · 30yr · 1.5% tax · 5.0% vac · 8.0% maint · 8.0% mgmt
Financing live
Cash to close
- Down payment
- $56,000
- Closing costs
- $6,720
- Reserves months
- —
- Total cash needed
- —
Loan-product check · same deal, 3 products live
Conventional
25% down · 7.5% · 30yr
- Down + closing
- —
- Monthly P&I
- —
- Monthly cashflow
- —
- DSCR
- —
- Eligible?
- —
Personal DTI + credit; lowest rate.
DSCR
20% down · 8.5% · 30yr
- Down + closing
- —
- Monthly P&I
- —
- Monthly cashflow
- —
- DSCR
- —
- Eligible?
- —
No personal income docs; deal must DSCR.
Hard money
10% down · 12.0% · 12mo
- Down + closing
- —
- Monthly P&I
- —
- Monthly cashflow
- —
- DSCR
- —
- Eligible?
- —
Short-term bridge; refi at stabilization.
Rent comps 40 comps
| Address | Beds | Baths | Sqft | Rent | $/sqft | DOM | Units | Dist |
|---|---|---|---|---|---|---|---|---|
| 1799 Courage Crk Crandall, TX | 3.0 | 2.0 | 1260 | $1,800 | $1.43 | 45d | 1 | 0.19mi |
| 1793 Courage Crk Crandall, TX | 4.0 | 2.0 | 1667 | $1,769 | $1.06 | 1d | 1 | 0.21mi |
| 1789 Courage Crk Crandall, TX | 4.0 | 2.0 | 1667 | $1,739 | $1.04 | 5d | 1 | 0.22mi |
| 2510 Flight Trl Crandall, TX | 4.0 | 2.0 | 1667 | $1,845 | $1.11 | 26d | 1 | 0.26mi |
| 2513 Flight Trl Crandall, TX | 4.0 | 2.0 | 1707 | $1,825 | $1.07 | 26d | 1 | 0.27mi |
| 2294 Great Belt Blvd Crandall, TX | 3.0 | 2.0 | 1266 | $1,815 | $1.43 | 26d | 1 | 0.29mi |
| 1507 Trick Riding Way Crandall, TX | 4.0 | 2.0 | 1850 | $1,900 | $1.03 | 26d | 1 | 0.29mi |
| 1507 Trick Riding Way Crandall, TX | 4.0 | 2.0 | 1850 | $1,900 | $1.03 | 1d | 1 | 0.29mi |
| 2511 Cornado Way Crandall, TX | 3.0 | 2.0 | 1239 | $1,799 | $1.45 | 26d | 1 | 0.30mi |
| 2302 Great Belt Blvd Crandall, TX | 3.0 | 2.0 | 1266 | $1,650 | $1.30 | 5d | 1 | 0.30mi |
| 2624 Bartlett St Crandall, TX | 4.0 | 2.0 | 1707 | $1,825 | $1.07 | 26d | 1 | 0.30mi |
| 2306 Great Belt Blvd Crandall, TX | 3.0 | 2.0 | 1266 | $1,695 | $1.34 | 45d | 1 | 0.31mi |
| 2521 Flight Trl Crandall, TX | 4.0 | 2.0 | 1707 | $1,825 | $1.07 | 26d | 1 | 0.31mi |
| 2311 Alcantara Ave Crandall, TX | 3.0 | 2.0 | 1220 | $1,740 | $1.43 | 1d | 1 | 0.31mi |
| 2739 Bronte Blvd Crandall, TX | 4.0 | 2.0 | 1707 | $1,825 | $1.07 | 26d | 1 | 0.32mi |
| 2409 Fleming Dr Crandall, TX | 4.0 | 2.0 | 1667 | $1,845 | $1.11 | 26d | 1 | 0.32mi |
| 2603 Khaju Grv Crandall, TX | 3.0 | 2.0 | 1266 | $1,699 | $1.34 | 5d | 1 | 0.32mi |
| 2504 Cornado Way Crandall, TX | 3.0 | 2.0 | 1440 | $1,799 | $1.25 | 45d | 1 | 0.33mi |
| 2746 Bronte Blvd Crandall, TX | 4.0 | 2.0 | 1707 | $1,825 | $1.07 | 26d | 1 | 0.34mi |
| 2745 Bronte Blvd Crandall, TX | 4.0 | 2.0 | 1667 | $1,845 | $1.11 | 26d | 1 | 0.34mi |
| 2908 Hearts Trl Crandall, TX | 3.0 | 3.0 | 1266 | $1,750 | $1.38 | 45d | 1 | 0.35mi |
| 2237 Mustang Ghost Trl Crandall, TX | 3.0 | 2.0 | 1952 | $2,040 | $1.05 | 45d | 1 | 0.35mi |
| 1930 Wild Orchard Ln Crandall, TX | 3.0 | 2.0 | 1411 | $1,865 | $1.32 | 45d | 1 | 0.44mi |
| 3315 Beckwith Way Crandall, TX | 3.0 | 2.0 | 1440 | $1,685 | $1.17 | 45d | 1 | 0.53mi |
| 2826 Hudson Dr Crandall, TX | 3.0 | 2.0 | 1639 | $2,400 | $1.46 | 8d | 1 | 0.58mi |
| 3007 Wallace Wells Ct Crandall, TX | 3.0 | 2.0 | 1440 | $1,950 | $1.35 | 45d | 1 | 0.60mi |
| 1209 Kings Pl Crandall, TX | 3.0 | 2.0 | 1356 | $1,975 | $1.46 | 3d | 1 | 0.62mi |
| 3352 Beckwith Way Crandall, TX | 3.0 | 2.0 | 1266 | $1,750 | $1.38 | 1d | 1 | 0.65mi |
| 2991 Wallace Wells Ct Crandall, TX | 3.0 | 2.0 | 1266 | $1,895 | $1.50 | 45d | 1 | 0.65mi |
| 3121 Helix Bay Dr Crandall, TX | 3.0 | 2.0 | 1440 | $1,675 | $1.16 | 45d | 1 | 0.67mi |
| 2973 Wallace Wells Ct Crandall, TX | 3.0 | 2.0 | 1440 | $1,665 | $1.16 | 45d | 1 | 0.70mi |
| 3103 Helix Bay Dr Crandall, TX | 3.0 | 2.0 | 1440 | $1,729 | $1.20 | 5d | 1 | 0.70mi |
| 3101 Helix Bay Dr Crandall, TX | 3.0 | 2.0 | 1266 | $1,745 | $1.38 | 26d | 1 | 0.70mi |
| 1609 Duke Dr Crandall, TX | 2.0–4.0 | 2.0–2.5 | 1614 | $2,490 | $1.54 | 0d | 1 | 0.71mi |
| 3147 Blossom Trl Crandall, TX | 4.0 | 3.0 | 2177 | $2,700 | $1.24 | 45d | 1 | 0.73mi |
| 3104 Helix Bay Dr Crandall, TX | 3.0 | 2.0 | 1266 | $1,675 | $1.32 | 26d | 1 | 0.73mi |
| 2961 Wallace Wells Ct Crandall, TX | 3.0 | 2.0 | 1266 | $1,855 | $1.47 | 4d | 1 | 0.73mi |
| 2960 Wallace Wells Ct Crandall, TX | 3.0 | 2.0 | 1440 | $2,000 | $1.39 | 45d | 1 | 0.75mi |
| 4001 Fairmont Ln Forney, TX | 4.0 | 2.0 | 1545 | $2,000 | $1.29 | 45d | 1 | 0.79mi |
| 3004 Dakota Trl Crandall, TX | 4.0 | 2.0 | 1938 | $2,300 | $1.19 | 6d | 1 | 0.79mi |
HOA detail
- Monthly dues
- $42 · $504/yr
Listing history 2 events
-
2026-03-17status Pending
-
2026-02-07$223,999 Active
ⓘ Source: listings_history table (triggers on properties + properties_extension) + one-shot
backfill from property_details.listing_events for pre-trigger history.
Tax reassessment forecast TX · Resets to sale price
- Current annual tax
- $1,915 · $160/mo
- Projected year-2 tax
- $4,099 · $342/mo
- Expected delta
- +$2,184/yr (+$182/mo · 114.1%)
ⓘ Screening estimate from a state-policy table — verify with the county assessor before closing.
Nearby sold comps map
Loading sold comps map…
Walkable amenities ~0.75 mi
Loading nearby amenities…
Taxation est. · year 1
- Rental income
- $24,906
- − Mortgage interest
- −$12,547
- − Property taxes
- −$1,915
- − Insurance
- −$1,120
- − Repairs & maintenance
- −$1,992
- − Management
- −$1,992
- − HOA
- −$504
- − Depreciation
- −$6,516
- Taxable loss
- −$1,682
- Est. tax savings @ 24.0%
- +$404
- After-tax cash flow
- $2,444/yr
For passive investors: Depreciation is non-cash, so a rental often shows a tax loss while cash-flowing — sheltering income. Rental losses are passive: they offset passive income freely, and up to $25,000/yr can offset ordinary (W-2) income if you actively participate and your MAGI is under $100k (phasing out to $0 by $150k); unused losses carry forward. On sale, claimed depreciation is recaptured at up to 25%, and gains may owe capital-gains tax (a 1031 exchange can defer both). Figures are a year-1 estimate at your 24.0% rate — not tax advice; consult a CPA.
Schools (NCES district)
- District
- Crandall ISD
- NCES district ID
- 4815510
- Math proficiency
- 36% ▼ -13.00%
- Reading proficiency
- 42% ▼ -8.00%
- Median HH income
- $70,076
- Composite
- 35.57/100
- National rank
- #4901
- State rank
- #351 of 826 in TX
Livability — Heartland
No livability data for this city. (Only ~50 U.S. cities are tracked.)
Census & demographics
- Census place
- Heartland, TX
- County
- Kaufman County · 122,338 people
- Metro
- Dallas-Fort Worth-Arlington, TX
- Population (ZIP)
- 9,333
- Household income
- $88,013
- Rent vs Own
- Severe rent burden
- 33.0
Population outlook (Kaufman County) Hauer SSP2
- Today (2025)
- 138,716 people
- By 2030
- 150,815 · +8.7%
- By 2040
- 174,877 · +26.1%
- By 2050
- 198,020 · +42.8%
- By 2075
- 251,908 · +81.6%
- By 2100
- 285,325 · +105.7%
Race, ethnicity, and origin ACS 2023
- Neighborhood character
- Diverse neighborhood (Simpson 0.62)
- Race & ethnicity
- White 48% Hispanic / Latino 36% Two or more races 14% Black 14%
- Hispanic origin (detail)
- Mexican 34%
- Common ancestry
- Slovak 1%
- Foreign-born
- 18% · Canada, China
- Languages at home
- 71% English-only · Spanish 27% Other Indo-European 1%
Political lean MEDSL · Kaufman
- 2024 margin
- Strong R (+27.9) · D 35.6% · R 63.5%
- 2008→2024 swing
- +7.9pp toward D · 2008: -35.8pp · 2024: -27.9pp
- All cycles
- 2024: R+27.9 2020: R+33.9 2016: R+47.0 2012: R+44.4 2008: R+35.8
Not yet ingested
- Civics
- —
Market trends
- HPI YoY
- ▼ -71.61%
- Current HPI
- 196.4773
- Rent YoY
- —
- Metro
- Dallas-Fort Worth-Arlington, TX
- State GDP YoY
- ▲ 3.95%
- F500 in state
- 110
Industry mix (Fortune 500 HQ in TX)
| Industry | F500 HQs | Revenue |
|---|---|---|
| Energy | 16 | $1,198B |
|
||
| Technology | 5 | $198B |
|
||
| Engineering / Construction | 4 | $72B |
|
||
| Energy Services | 3 | $60B |
|
||
| Utilities | 3 | $41B |
|
||
| Healthcare | 2 | $330B |
|
||
Price history
2 events — show timeline
- 2026-03-17 Pending — NTREIS
- 2026-02-07 Listed $223,999 NTREIS
Property tax history
-5.8%/yrLatest (2025): $1,915 · -5.8% YoY. Source: county tax records.
Cash-flow waterfall
monthlySold comps — $/sqft
last 12 mo · ≤1 miLoading sold comps…