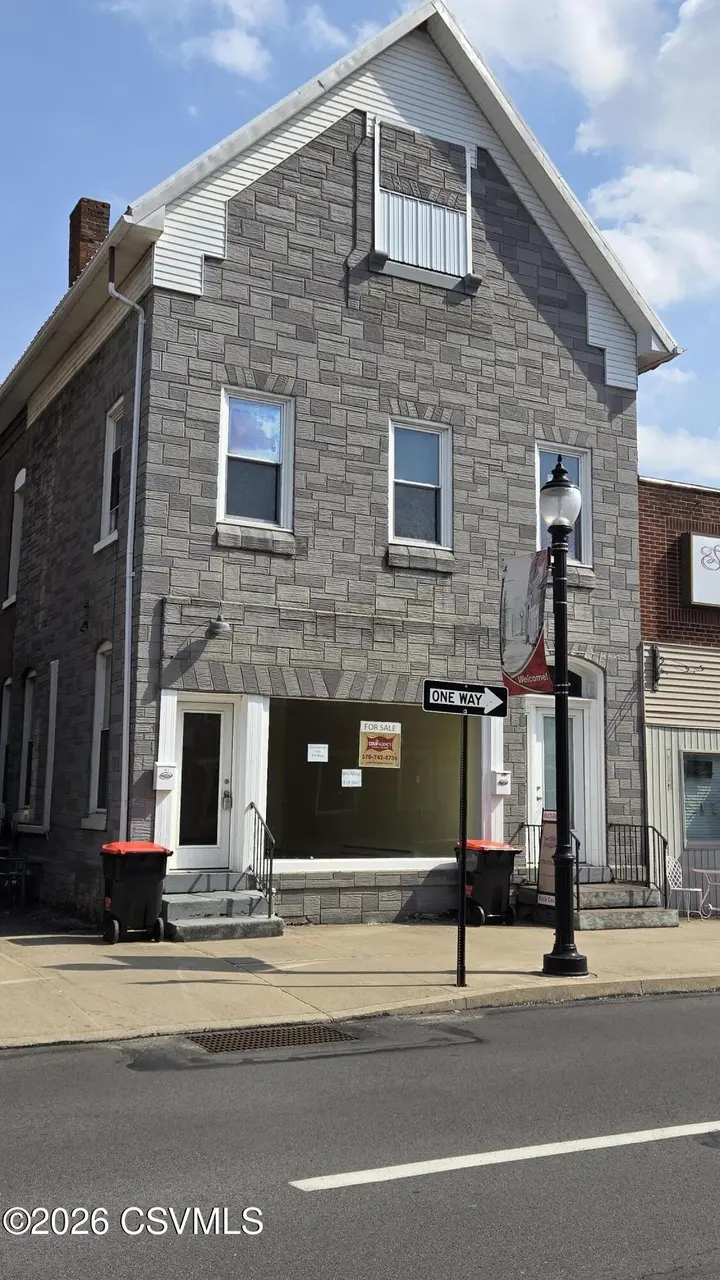
115 S Front St
Milton, PA 17847
$230,000C+
3 bd · 2.5 ba ·
2,862 sqft ·
Built 1900
· MultiFamily
· Active
· 281 DOM
Cashflow @ list (25.0% down · 7.5%)
Estimated rent
$3,260/mo
Mortgage (P&I)
−$1,206
Tax + insurance
−$383
HOA
−$0
Vac / Maint / Mgmt
−$685
Net cashflow
$986/mo
Annual
$11,831/yr
Cap rate
11.44%
Cash-on-cash
18.37%
DSCR
1.82
1% rule
1.42%
Cash to close
$64,400
Investor read
- This is a 3-bed/2.5-bath multifamily listed at $230k. Condition is rated fair.
- At list price, monthly cash flow is $986 ($12k/yr) — positive.
- The deal already cash-flows at list — no discount required.
- Meets the 1% rule at list price ($3k rent vs $230k).
- It's been on market 281 days — a 12% lower offer ($202k) is reasonable based on typical stale-listing flexibility.
- Recommended offer: $202k (12.0% below list) — sets the bar for market timing.
- Local home prices are declining (-3.0%/yr); year-one equity from $2k of loan paydown is wiped out by about $7k of value loss. Plan a longer hold.
- Location reads 67/100 on livability (#951 in PA) — a middle-class / working-renter tenant base. Strengths: cost of living A+, housing A+; Watch: schools C-, employment D, health & safety D.
- Milton Area SD (town): math 37% / reading 55% proficiency, ranked #264 of 539 in PA (top 49%) — families likely to look elsewhere, expect single-tenant / working-renter base with shorter leases.
- Watch-outs: built in 1900 — expect roof / HVAC / electrical / plumbing capex.
- Market conditions: 31 active listings in the ZIP; 1 comparable units currently listed for rent nearby; 81 units permitted in Northumberland County in 2024 (0 in 5+ unit buildings).
- Northumberland County population projected at -11% by 2050 — secular population decline; favor cash flow + early exit over multi-decade hold.
- 2 sale attempts with the ask held roughly flat each time — persistent listings suggest the price (not the market) is what's stuck; bring a comps-based counter.
- At projected returns (-3.0% appreciation + 3.0% rent growth), your $64k cash investment doubles in ~7 years — after that, you're playing with house money.
- Cap rate 11.4% vs local median 3.6% in Milton — top-decile yield for the area; either an underpriced asset or a hidden risk that comps aren't pricing in. Stress-test before assuming the spread holds.
- At $3,260/mo this rent would consume 67% of the median local household income ($59k/yr) (locally 112% of renters already pay >50% of income on rent) — very limited rent-growth headroom before tenants either downsize or default.
Questions for listing agent
- It's been on market 281 days. Have you received any prior offers? Is the seller open to a 12% concession, seller financing, or rate buy-down credit?
- Have any recent inspections been done? Can we get a copy of the seller's disclosures and any deferred-maintenance estimates?
- Built in 1900 — when were the roof, HVAC, electrical panel, plumbing, and water heater last replaced?
- Why hasn't it sold? Are there any deal-killer items the seller is aware of (foundation, flood, title, zoning, code violations)?
- Is there a deadline driving the sale (1031 exchange, divorce, estate, relocation)? That informs how much negotiation room exists.
- What's the average days-on-market for RENTAL listings here right now (not sales)? A rising rental-DOM trend means longer vacancies and softer asking-rent achievability than the comps imply.
- What's the recent tenant-quality profile in this submarket — average credit score on applications, eviction rate, late-payment / NSF rate, and stable-employment percentage? A property-management company in the area should have these aggregated.
- How much new apartment / multifamily construction is in the pipeline within 1–3 miles? Heavy new supply (>2% of stock underway) typically softens rents 12–24 months out; light construction supports rent growth.
Repairs flagged (vision-AI assessment)
- Major: exterior siding — Significant wear and tear
- Major: roof — No visible damage, but age is unknown
- Major: bathrooms — No visible damage, but age is unknown
CashFlowRE · CFR-9PPFNT7MMHRKRE
· Data 1 day ago
cashflowre.app · 2026-05-29