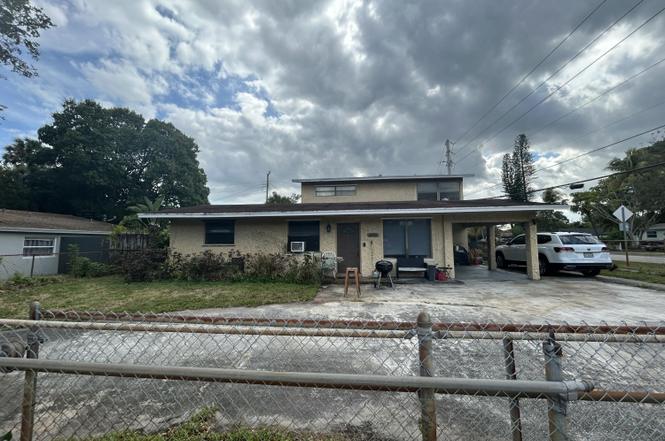
3390 NW 8th Pl
Lauderhill, FL 33311
$220,700B
4 bd · 3.0 ba ·
2,446 sqft ·
Built 1960
· SingleFamily
· Pending
· 26 DOM
Cashflow @ list (25.0% down · 7.5%)
Estimated rent
$3,299/mo
Mortgage (P&I)
−$1,157
Tax + insurance
−$368
HOA
−$0
Vac / Maint / Mgmt
−$693
Net cashflow
$1,081/mo
Annual
$12,976/yr
Cap rate
12.17%
Cash-on-cash
21.00%
DSCR
1.93
1% rule
1.49%
Cash to close
$61,796
Investor read
- This is a 4-bed/3.0-bath single-family listed at $221k.
- At list price, monthly cash flow is $1k ($13k/yr) — positive.
- The deal already cash-flows at list — no discount required.
- Meets the 1% rule at list price ($3k rent vs $221k).
- It's been on market 26 days — a 2% lower offer ($217k) is reasonable based on typical stale-listing flexibility.
- Recommended offer: $217k (1.5% below list) — sets the bar for market timing.
- Local home prices are declining (-3.0%/yr); year-one equity from $2k of loan paydown is wiped out by about $7k of value loss. Plan a longer hold.
- Location reads 79/100 on livability (#139 in FL, #2,059 nationally) — a middle-class / working-renter tenant base. Strengths: commute A+, cost of living A+, housing A+; Watch: employment D, amenities F.
- Broward (suburban): math 42% / reading 53% proficiency, ranked #46 of 73 in FL (top 63%) — families likely to look elsewhere, expect single-tenant / working-renter base with shorter leases.
- Zoned schools: Parkway Middle School (math 25% / reading 40%, grade F, #443 of 571 statewide, top 78%, 1,198 students, 83% FRL); Dillard 6-12 (math 19% / reading 31%, grade F, #501 of 667 statewide, top 75%, 2,279 students, 80% FRL) — zoned schools average 82% FRL vs 51% district-wide (30 pts higher); higher-poverty schools than district average — tighter screening recommended.
- Zoned-school proficiency averages 29% at this address vs 48% district-wide (-19 pts) — the specific schools serving this property underperform the Broward average; the district grade overstates school quality for this exact location.
- Market conditions: Rents rising (+2.8%/yr); 585 active listings in the ZIP; 27 comparable units currently listed for rent nearby; rentals at typical pace (median 25d on market — plan ~3-4 weeks tenant-placement turnaround); 2,111 units permitted in Broward County in 2024 (1,265 in 5+ unit buildings).
- Broward County population projected at +34% by 2050 — long-run rental-demand tailwind backs the buy-and-hold thesis.
- Current owner paid $8k; list at $221k implies a 2496% gain — meaningful room to come down on a strong offer.
- At projected returns (-3.0% appreciation + 2.8% rent growth), your $62k cash investment doubles in ~6 years — after that, you're playing with house money.
- Climate carrying-cost: severe wind risk, 99% chance of damaging wind over 30y; extreme-heat days projected 7→25/yr by 2055 (HVAC capex compounding) — expect insurance premiums to compound above CPI over the hold.
- Cap rate 12.2% vs local median 4.3% in Lauderhill — top-decile yield for the area; either an underpriced asset or a hidden risk that comps aren't pricing in. Stress-test before assuming the spread holds.
- At $3,299/mo this rent would consume 73% of the median local household income ($54k/yr) (locally 5068% of renters already pay >50% of income on rent) — very limited rent-growth headroom before tenants either downsize or default.
Questions for listing agent
- Built in 1960 — when were the roof, HVAC, electrical panel, plumbing, and water heater last replaced?
- Is there a deadline driving the sale (1031 exchange, divorce, estate, relocation)? That informs how much negotiation room exists.
- Schools are D-rated, which usually means shorter tenancies and higher turnover. Who's the typical renter profile here, and what's been the actual vacancy rate?
- What's the average days-on-market for RENTAL listings here right now (not sales)? A rising rental-DOM trend means longer vacancies and softer asking-rent achievability than the comps imply.
- What's the recent tenant-quality profile in this submarket — average credit score on applications, eviction rate, late-payment / NSF rate, and stable-employment percentage? A property-management company in the area should have these aggregated.
- How much new for-sale + rental construction is in the pipeline within 1–3 miles? Heavy new supply typically softens prices + rents 12–24 months out; constrained supply supports both.
CashFlowRE · CFR-9R1601DYVVX4H2
· Data 5 days ago
cashflowre.app · 2026-05-29