 🏷️ Likely Rental
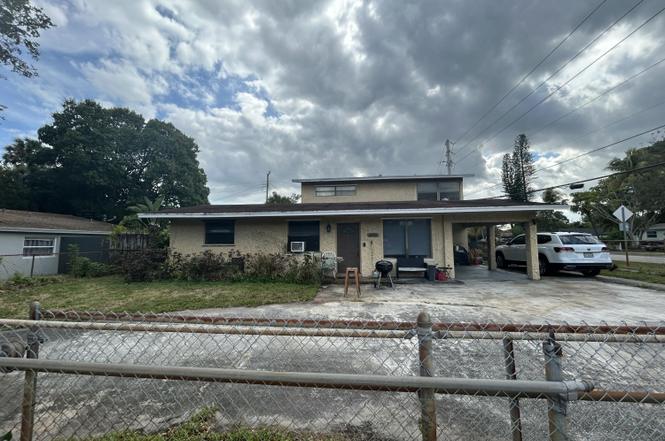
3390 NW 8th Pl · Lauderhill, FL
Flood risk 1/10 · Minimal
- FEMA flood zone
- X (shaded)
- Chance of flooding over 30 yrs
- 0.0%
- Est. flood insurance / yr
- $507 – $1,088
Fire risk 1/10 · Minimal
- Est. fire insurance / yr
- $947 – $1,759
Heat risk 10/10 · Severe
- Hot days now (above 105°F)
- 7 days/yr
- Hot days in 30 yrs
- 25 days/yr
Wind risk 10/10 · Severe
- Chance of severe wind over 30 yrs
- 99.0%
Air-quality risk 2/10 · Minimal
- Unhealthy air days now
- 2 days/yr
- Unhealthy air days in 30 yrs
- 2 days/yr
Risk factors via First Street. Map © Google.
Why this score? — see what drove the B grade
The composite is a weighted blend of 9 inputs, each scored 0–100. Each bar is that input's sub-score; the figure is the points it added to the 100-point composite (weight × sub-score).
- Cash flow +30.0/30.0
- DSCR +10.0/10.0
- 1% rule +9.9/10.0
- ARV discount +7.5/15.0
- Schools +4.1/10.0
- Livability +4.0/5.0
- Rent growth +3.2/5.0
- Condition / age +2.5/5.0
- Appreciation +0.0/10.0
$220,700
🖨 Deal sheet 📄 Offer letter ✓ Due diligence
Listing remarks
Estate Sale, probate has cleared. This is a great investor opportunity, large home situated on an expansive corner lot. Main floor has a galley kitchen, 2 bedrooms, a bath, plus formal living room, home office & den. Upstairs has a huge primary bed with en suite bath & a large secondry bedroom. With the right investment, this could be a profitable endeavor. Tenant occupied, please do not disturb. Cash offers only, seller is motivated!
Key facts
- Galley kitchen
- Formal living room
- En suite bath
Tags
Neighborhood map
What this means for you Summary
Snapshot
- This is a 4-bed/3.0-bath single-family listed at $221k.
Deal economics
- At list price, monthly cash flow is $1k ($13k/yr) — positive.
- The deal already cash-flows at list — no discount required.
- Meets the 1% rule at list price ($3k rent vs $221k).
- Recommended offer: $217k (1.5% below list) — sets the bar for market timing.
- Cap rate 12.2% vs local median 4.3% in Lauderhill — top-decile yield for the area; either an underpriced asset or a hidden risk that comps aren't pricing in. Stress-test before assuming the spread holds.
Location & tenants
- Location reads 79/100 on livability (#139 in FL, #2,059 nationally) — a middle-class / working-renter tenant base. Strengths: commute A+, cost of living A+, housing A+; Watch: employment D, amenities F.
- Broward (suburban): math 42% / reading 53% proficiency, ranked #46 of 73 in FL (top 63%) — families likely to look elsewhere, expect single-tenant / working-renter base with shorter leases.
- Zoned schools: Parkway Middle School (math 25% / reading 40%, grade F, #443 of 571 statewide, top 78%, 1,198 students, 83% FRL); Dillard 6-12 (math 19% / reading 31%, grade F, #501 of 667 statewide, top 75%, 2,279 students, 80% FRL) — zoned schools average 82% FRL vs 51% district-wide (30 pts higher); higher-poverty schools than district average — tighter screening recommended.
- Zoned-school proficiency averages 29% at this address vs 48% district-wide (-19 pts) — the specific schools serving this property underperform the Broward average; the district grade overstates school quality for this exact location.
- Market conditions: Rents rising (+2.8%/yr); 585 active listings in the ZIP; 27 comparable units currently listed for rent nearby; rentals at typical pace (median 24d on market — plan ~3-4 weeks tenant-placement turnaround); 2,111 units permitted in Broward County in 2024 (1,265 in 5+ unit buildings).
- At $3,299/mo this rent would consume 73% of the median local household income ($54k/yr) (locally 5068% of renters already pay >50% of income on rent) — very limited rent-growth headroom before tenants either downsize or default.
Forward outlook
- Local home prices are declining (-3.0%/yr); year-one equity from $2k of loan paydown is wiped out by about $7k of value loss. Plan a longer hold.
- Broward County population projected at +34% by 2050 — long-run rental-demand tailwind backs the buy-and-hold thesis.
- At projected returns (-3.0% appreciation + 2.8% rent growth), your $62k cash investment doubles in ~6 years — after that, you're playing with house money.
Negotiation context
- It's been on market 26 days — a 2% lower offer ($217k) is reasonable based on typical stale-listing flexibility.
- Current owner paid $8k; list at $221k implies a 2496% gain — meaningful room to come down on a strong offer.
Risks & watch-outs
- Climate carrying-cost: severe wind risk, 99% chance of damaging wind over 30y; extreme-heat days projected 7→25/yr by 2055 (HVAC capex compounding) — expect insurance premiums to compound above CPI over the hold.
Questions for the listing agent
- Built in 1960 — when were the roof, HVAC, electrical panel, plumbing, and water heater last replaced?
- Is there a deadline driving the sale (1031 exchange, divorce, estate, relocation)? That informs how much negotiation room exists.
- Schools are D-rated, which usually means shorter tenancies and higher turnover. Who's the typical renter profile here, and what's been the actual vacancy rate?
- What's the average days-on-market for RENTAL listings here right now (not sales)? A rising rental-DOM trend means longer vacancies and softer asking-rent achievability than the comps imply.
- What's the recent tenant-quality profile in this submarket — average credit score on applications, eviction rate, late-payment / NSF rate, and stable-employment percentage? A property-management company in the area should have these aggregated.
- How much new for-sale + rental construction is in the pipeline within 1–3 miles? Heavy new supply typically softens prices + rents 12–24 months out; constrained supply supports both.
Investment metrics
- 1% rule
- 1.49% ✓
- Cap rate
- 12.17%
- Cash-on-cash
- 21.00%
- DSCR
- 1.93
- GRM
- 5.6
CMA / ARV
- ARV (on-the-fly)
- $508,768
- Comps found
- 1
Show comp detail 1 sale within ~0.75 mi
| Address | Dist | Beds/Ba | Sqft | Sold | Price | $/sf | Match |
|---|---|---|---|---|---|---|---|
| 440 NW 29th Ter | 0.74mi | 4/3.0 | 2,523 (+3%) | 18mo | $525,000 | $208 | 45 |
Match score weights: distance 35% · size 25% · config 20% · recency 20%. Top-matched comps best support the ARV.
Projected returns pro-forma
-3.0% appreciation · 2.78% rent growth · sell at horizon
- IRR
- 13.2%
- Equity multiple
- 1.52×
- Total profit
- $32,428
- Equity at exit
- $32,907
- IRR
- 21.9%
- Equity multiple
- 2.85×
- Total profit
- $114,145
- Equity at exit
- $19,082
Cash invested: $61,796 (down + closing). Projections, not guarantees.
Landlord ↔ Tenant lean methodology
- Overall (STATE)
- 87 Strongly Landlord-Friendly
- State Florida
- 87 Strongly Landlord-Friendly · R+3
- County
- — inherits STATE
- City
- — inherits STATE
ZIP-level market 33311
- Rents YoY
- 2.8%
- Active inventory
- 585
- Price-to-rent
- 5.6×
Monthly cashflow live
- Estimated rent
- $3,299 high interval (Pro) →
- Mortgage (P&I)
- −$1,157
- Tax est. 1.5%
- −$276 /mo · $3,310/yr
- Insurance
- −$92
- HOA
- −$0
- Vacancy / Maint / Mgmt
- −$693
- Net cashflow
- $1,081
Break-even live
UW: 25.0% down · 7.5% · 30yr · 1.5% tax · 5.0% vac · 8.0% maint · 8.0% mgmt
Financing live
Cash to close
- Down payment
- $55,175
- Closing costs
- $6,621
- Reserves months
- —
- Total cash needed
- —
Loan-product check · same deal, 3 products live
Conventional
25% down · 7.5% · 30yr
- Down + closing
- —
- Monthly P&I
- —
- Monthly cashflow
- —
- DSCR
- —
- Eligible?
- —
Personal DTI + credit; lowest rate.
DSCR
20% down · 8.5% · 30yr
- Down + closing
- —
- Monthly P&I
- —
- Monthly cashflow
- —
- DSCR
- —
- Eligible?
- —
No personal income docs; deal must DSCR.
Hard money
10% down · 12.0% · 12mo
- Down + closing
- —
- Monthly P&I
- —
- Monthly cashflow
- —
- DSCR
- —
- Eligible?
- —
Short-term bridge; refi at stabilization.
Rent comps 27 comps
| Address | Beds | Baths | Sqft | Rent | $/sqft | DOM | Units | Dist |
|---|---|---|---|---|---|---|---|---|
| 3451 NW 6th St Lauderhill, FL | 4.0 | 2.0 | 1700 | $3,000 | $1.76 | 24d | 1 | 0.28mi |
| 2988 NW 7th Ct Fort Lauderdale, FL | 4.0 | 2.0 | 2547 | $3,200 | $1.26 | 4d | 1 | 0.48mi |
| 2862 NW 11th St Fort Lauderdale, FL | 3.0 | 2.5 | 1800 | $3,300 | $1.83 | 24d | 1 | 0.70mi |
| 677 NW 42nd Ave #677 Plantation, FL | 3.0 | 2.5 | 1672 | $2,500 | $1.50 | 24d | 1 | 0.82mi |
| 677 NW 42nd Ave #677 Plantation, FL | 3.0 | 2.5 | 1672 | $2,400 | $1.44 | 7d | 1 | 0.82mi |
| 3551 SW 1st St Fort Lauderdale, FL | 4.0 | 2.0 | 1720 | $3,150 | $1.83 | 24d | 1 | 0.90mi |
| 1123 NW 27th Ave Unit 1 Fort Lauderdale, FL | 3.0 | 1.0 | 1617 | $2,400 | $1.48 | 7d | 1 | 0.93mi |
| 1123 NW 27th Ave Unit 1 Fort Lauderdale, FL | 3.0 | 1.0 | 1617 | $2,400 | $1.48 | 24d | 1 | 0.93mi |
| 2835 NW 14th St Unit 1 Fort Lauderdale, FL | 3.0 | 2.0 | 1630 | $2,990 | $1.83 | 24d | 1 | 0.98mi |
| 180 Penn Way Fort Lauderdale, FL | 5.0 | 3.0 | 1638 | $3,750 | $2.29 | 22d | 1 | 1.01mi |
| 1130 NW 43rd Ter Lauderhill, FL | 5.0 | 2.0 | 1580 | $4,695 | $2.97 | 7d | 1 | 1.01mi |
| 4384 NW 9th St Unit 4384 Plantation, FL | 3.0 | 2.5 | 1616 | $3,550 | $2.20 | 24d | 1 | 1.02mi |
| 4393 NW 9th St Unit 4393 Plantation, FL | 3.0 | 2.5 | 1616 | $3,500 | $2.17 | 24d | 1 | 1.03mi |
| 2780 NW 15th St Fort Lauderdale, FL | 3.0 | 2.5 | 1622 | $3,200 | $1.97 | 24d | 1 | 1.06mi |
| 913 NW 45th Ter Unit 913 Plantation, FL | 3.0 | 2.5 | 1616 | $3,525 | $2.18 | 24d | 1 | 1.14mi |
| 491 NW 45th Ter Plantation, FL | 5.0 | 2.0 | 2103 | $4,000 | $1.90 | 7d | 1 | 1.15mi |
| 410 Pennsylvania Ave Fort Lauderdale, FL | 3.0 | 2.0 | 1928 | $3,600 | $1.87 | 24d | 1 | 1.22mi |
| 4350 NW 14th St Lauderhill, FL | 3.0 | 3.0 | 1590 | $3,000 | $1.89 | 4d | 1 | 1.26mi |
| 4350 NW 14th St Lauderhill, FL | 3.0 | 3.0 | 1590 | $3,500 | $2.20 | 24d | 1 | 1.26mi |
| 525 NW 22nd Ave Fort Lauderdale, FL | 5.0 | 2.0 | 1936 | $3,500 | $1.81 | 2d | 1 | 1.28mi |
| 2841 SW 4th Ct Unit 1258737P Fort Lauderdale, FL | 3.0 | 2.0 | 1689 | $4,617 | $2.73 | 5d | 1 | 1.30mi |
| 1650 NW 26th Ter Fort Lauderdale, FL | 4.0 | 2.0 | 2010 | $3,500 | $1.74 | 24d | 1 | 1.30mi |
| 2836 SW 4th Ct Fort Lauderdale, FL | 3.0 | 2.0 | 1617 | $3,300 | $2.04 | 24d | 1 | 1.32mi |
| 4360 NW 15th St Lauderhill, FL | 5.0 | 2.0 | 2000 | $4,300 | $2.15 | 24d | 1 | 1.32mi |
| 519 NW 21st Ter Fort Lauderdale, FL | 4.0 | 2.0 | 2591 | $3,600 | $1.39 | 7d | 1 | 1.35mi |
| 610 Carolina Ave Unit 2 Fort Lauderdale, FL | 4.0 | 3.0 | 1865 | $2,000 | $1.07 | 14d | 1 | 1.36mi |
| 649 W Evanston Cir Fort Lauderdale, FL | 4.0 | 2.0 | 1576 | $3,315 | $2.10 | 24d | 1 | 1.42mi |
Listing history 6 events
-
2026-06-15price $220,700 Pending 26 DOM
-
2026-03-17status Pending
-
2026-03-16price $355,700
-
2026-02-19$405,900 Active
-
1968-12-01soldstatus $8,500
-
1968-03-01soldstatus $7,000
ⓘ Source: listings_history table (triggers on properties + properties_extension) + one-shot
backfill from property_details.listing_events for pre-trigger history.
Climate risk First Street
- Flood 1/10 Low FEMA zone X (shaded) · 0% chance over 30 yrs
- Wildfire 1/10 Low
- Heat 10/10 Extreme 7 d/yr ≥105°F today · 25 d/yr by 30 yrs out
- Wind 10/10 Extreme 99% chance of damaging wind over 30 yrs
- Air quality 2/10 Low 2 unhealthy d/yr today · 2 by 30 yrs out
Nearby sold comps map
Loading sold comps map…
Walkable amenities ~0.75 mi
Loading nearby amenities…
Taxation est. · year 1
- Rental income
- $39,593
- − Mortgage interest
- −$12,363
- − Property taxes
- −$3,310
- − Insurance
- −$1,104
- − Repairs & maintenance
- −$3,167
- − Management
- −$3,167
- − Depreciation
- −$6,420
- Taxable income
- $10,061
- Est. tax owed @ 24.0%
- −$2,415
- After-tax cash flow
- $10,561/yr
For passive investors: Depreciation is non-cash, so a rental often shows a tax loss while cash-flowing — sheltering income. Rental losses are passive: they offset passive income freely, and up to $25,000/yr can offset ordinary (W-2) income if you actively participate and your MAGI is under $100k (phasing out to $0 by $150k); unused losses carry forward. On sale, claimed depreciation is recaptured at up to 25%, and gains may owe capital-gains tax (a 1031 exchange can defer both). Figures are a year-1 estimate at your 24.0% rate — not tax advice; consult a CPA.
Schools (NCES district)
- District
- Broward
- NCES district ID
- 1200180
- Math proficiency
- 42% ▼ -18.00%
- Reading proficiency
- 53% ▼ -5.00%
- Median HH income
- $52,139
- Composite
- 40.88/100
- National rank
- #3621
- State rank
- #46 of 73 in FL
Livability — Lauderhill
- Score
- 79/100
- State rank
- #139
- US rank
- #2059
Category grades
Schools grade is shown separately in the Schools card above.
Census & demographics
- Census place
- Lauderhill, FL
- County
- Broward County · 1,963,430 people
- City population
- 62,807
- Metro
- Miami-Fort Lauderdale-Pompano Beach, FL
- Population (ZIP)
- 74,898
- Household income
- $53,973
- Rent vs Own
- Severe rent burden
- 5068.0
Population outlook (Broward County) Hauer SSP2
- Today (2025)
- 2,207,033 people
- By 2030
- 2,360,704 · +7.0%
- By 2040
- 2,661,208 · +20.6%
- By 2050
- 2,946,698 · +33.5%
- By 2075
- 3,602,273 · +63.2%
- By 2100
- 3,970,984 · +79.9%
Race, ethnicity, and origin ACS 2023
- Neighborhood character
- Predominantly Black (77%)
- Race & ethnicity
- Black 77% Two or more races 9% White 9% Hispanic / Latino 9%
- Hispanic origin (detail)
- Mexican 1% Puerto Rican 2% Cuban 1%
- Common ancestry
- Hispanic 15% Lithuanian 1% Romanian 0%
- Foreign-born
- 24% · Canada, Jamaica
- Languages at home
- 78% English-only · French/Haitian/Cajun 14% Spanish 6% Other Indo-European 1%
Political lean MEDSL · Broward
- 2024 margin
- D (+17.0) · D 58.0% · R 41.0%
- 2008→2024 swing
- -17.8pp toward R · 2008: 34.7pp · 2024: 17.0pp
- All cycles
- 2024: D+17.0 2020: D+29.8 2016: D+35.0 2012: D+34.9 2008: D+34.7
Not yet ingested
- Civics
- —
Market trends
- HPI YoY
- ▼ -300.68%
- Current HPI
- 535.2504
- Rent YoY
- ▲ 2.78%
- Metro
- Miami-Fort Lauderdale-Pompano Beach, FL
- State GDP YoY
- ▲ 3.28%
- F500 in state
- 36
Industry mix (Fortune 500 HQ in FL)
| Industry | F500 HQs | Revenue |
|---|---|---|
| Industrial Technology | 2 | $29B |
|
||
| Insurance | 2 | $17B |
|
||
| Retail | 1 | $60B |
|
||
| Technology Distribution | 1 | $58B |
|
||
| Homebuilding | 1 | $35B |
|
||
| Technology Manufacturing | 1 | $35B |
|
||
Price history
+4981.4% since first listed5 events — show timeline
- 2026-03-17 Pending — Beaches MLS
- 2026-03-16 Price Changed $355,700 Beaches MLS
- 2026-02-19 Listed $405,900 Beaches MLS
- 1968-12-01 Sold (Public Records) $8,500 Public Records
- 1968-03-01 Sold (Public Records) $7,000 Public Records
Property tax history
+13.3%/yrLatest (2025): $12,032 · +6.5% YoY. Source: county tax records.
Cash-flow waterfall
monthlySold comps — $/sqft
last 12 mo · ≤1 miLoading sold comps…