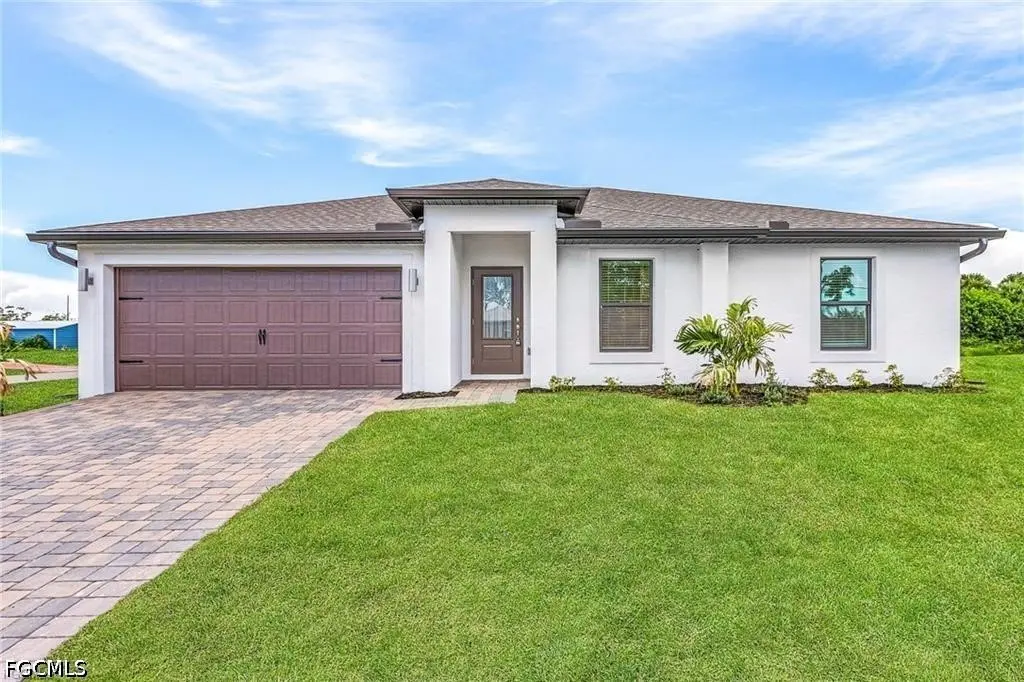
936 Admiral Bull Halsey Ave
Fort Denaud, FL 33935
$294,900D
3 bd · 2.0 ba ·
1,264 sqft ·
Built 2023
· SingleFamily
· Active
· 4 DOM
Cashflow @ list (25.0% down · 7.5%)
Estimated rent
$2,318/mo
Mortgage (P&I)
−$1,546
Tax + insurance
−$485
HOA
−$150
Vac / Maint / Mgmt
−$487
Net cashflow
$-350/mo
Annual
$-4,202/yr
Cap rate
4.87%
Cash-on-cash
-5.09%
DSCR
0.77
1% rule
0.79%
Cash to close
$82,572
Investor read
- This is a 3-bed/2.0-bath single-family listed at $295k.
- At list price, monthly cash flow is $-350 ($-4k/yr) — negative.
- To cash-flow at today's rent, offer at most $233k (21.0% below list).
- To meet the 1% rule (rent ≥ 1% of price), the offer needs to be $232k (21.4% below list).
- Only 4 days on market — expect competitive offers; lowballing is unlikely to land.
- Recommended offer: $232k (21.4% below list) — sets the bar for 1% rule.
- In year one you build about $32k of equity ($2k loan paydown + $29k appreciation (10.0% local appreciation)).
- Location reads 65/100 on livability (#635 in FL) — a middle-class / working-renter tenant base. Strengths: crime A+, cost of living A+, housing A+; Watch: amenities F, commute F, health & safety D-.
- Hendry (town): math 35% / reading 40% proficiency, ranked #65 of 73 in FL (top 89%) — families likely to look elsewhere, expect single-tenant / working-renter base with shorter leases; 75% free/reduced lunch — lower-income household profile, screen leases tightly.
- Zoned schools: Labelle Elementary School (math 37% / reading 37%, grade F, #1,609 of 2,144 statewide, top 77%, 437 students, 77% FRL); Labelle Middle School (math 37% / reading 38%, grade F, #395 of 571 statewide, top 70%, 817 students, 72% FRL); Labelle High School (math 42% / reading 41%, grade F, #284 of 667 statewide, top 43%, 1,451 students, 62% FRL).
- Market conditions: 950 active listings in the ZIP; 2 comparable units currently listed for rent nearby; 557 units permitted in Hendry County in 2024 (45 in 5+ unit buildings).
- Hendry County population projected to shrink 7% by 2050 — rents likely to lag national; underwrite the cash flow, not the appreciation.
- 6 sale attempts since 5y ago with the ask held roughly flat each time — persistent listings suggest the price (not the market) is what's stuck; bring a comps-based counter.
- By year 2, paydown + projected appreciation supports a ~$51k cash-out refi (75% LTV) — recoverable capital for the next deal without selling this one.
- Climate carrying-cost: severe wind risk, 99% chance of damaging wind over 30y; moderate wildfire risk; extreme-heat days projected 7→23/yr by 2055 (HVAC capex compounding) — expect insurance premiums to compound above CPI over the hold.
- Cap rate 4.9% vs local median 3.0% in Fort Denaud — top-decile yield for the area; either an underpriced asset or a hidden risk that comps aren't pricing in. Stress-test before assuming the spread holds.
- At $2,318/mo this rent would consume 49% of the median local household income ($57k/yr) (locally 498% of renters already pay >50% of income on rent) — very limited rent-growth headroom before tenants either downsize or default.
Questions for listing agent
- What do current leases actually rent for vs. the listed asking? Can we see a recent rent roll and the last 12 months of T-12 income?
- What does the HOA fee cover, when was the last increase, and are there any pending special assessments or reserve-fund shortfalls?
- Is there a deadline driving the sale (1031 exchange, divorce, estate, relocation)? That informs how much negotiation room exists.
- Schools are F-rated, which usually means shorter tenancies and higher turnover. Who's the typical renter profile here, and what's been the actual vacancy rate?
- The area grade is low — what's the realistic commute time and amenity access for the typical tenant pool here? Any planned neighborhood developments (good or bad) we should know about?
- What's the average days-on-market for RENTAL listings here right now (not sales)? A rising rental-DOM trend means longer vacancies and softer asking-rent achievability than the comps imply.
- What's the recent tenant-quality profile in this submarket — average credit score on applications, eviction rate, late-payment / NSF rate, and stable-employment percentage? A property-management company in the area should have these aggregated.
- How much new for-sale + rental construction is in the pipeline within 1–3 miles? Heavy new supply typically softens prices + rents 12–24 months out; constrained supply supports both.
CashFlowRE · CFR-9R6PJMDZ1RM3F6
· Data 19 h ago
cashflowre.app · 2026-05-29