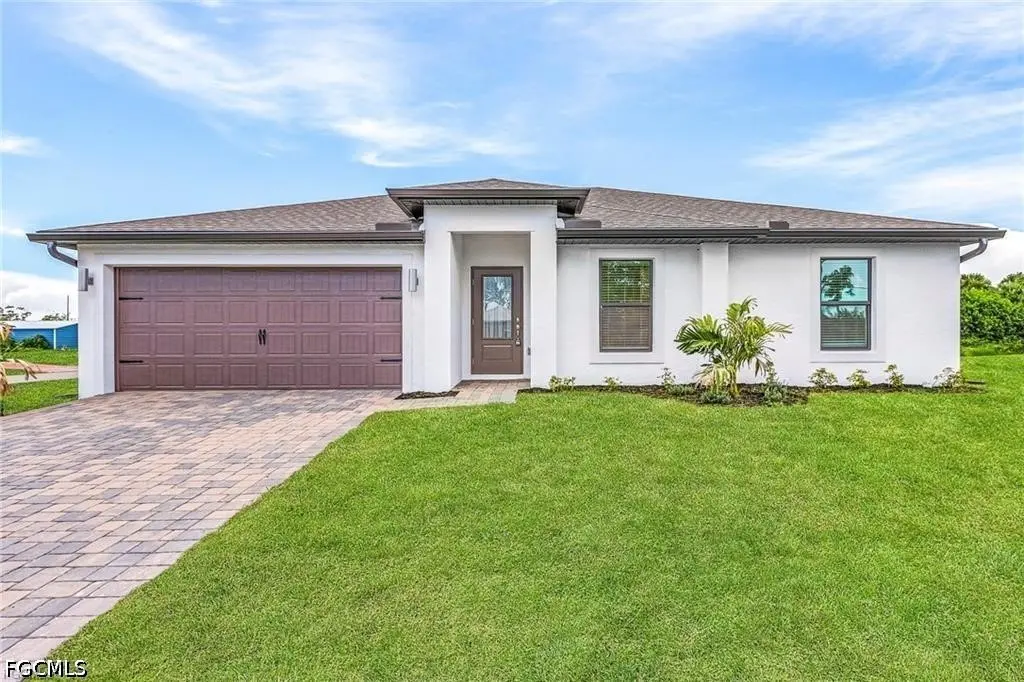
936 Admiral Bull Halsey Ave · Fort Denaud, FL
Flood risk 1/10 · Minimal
- FEMA flood zone
- X (unshaded)
- Chance of flooding over 30 yrs
- 0.0%
- Est. flood insurance / yr
- $507 – $1,088
Fire risk 5/10 · Moderate
- Est. fire insurance / yr
- $947 – $1,759
Heat risk 9/10 · Severe
- Hot days now (above 109°F)
- 7 days/yr
- Hot days in 30 yrs
- 23 days/yr
Wind risk 10/10 · Severe
- Chance of severe wind over 30 yrs
- 99.0%
Air-quality risk 1/10 · Minimal
- Unhealthy air days now
- 0 days/yr
- Unhealthy air days in 30 yrs
- 0 days/yr
Risk factors via First Street. Map © Google.
Why this score? — see what drove the D grade
The composite is a weighted blend of 9 inputs, each scored 0–100. Each bar is that input's sub-score; the figure is the points it added to the 100-point composite (weight × sub-score).
- ARV discount +10.5/15.0
- Appreciation +10.0/10.0
- Cash flow +7.6/30.0
- Livability +3.2/5.0
- Schools +3.1/10.0
- 1% rule +2.9/10.0
- Rent growth +2.5/5.0
- Condition / age +2.5/5.0
- DSCR +1.7/10.0
$294,900
🖨 Deal sheet (PDF) 📄 Offer letter ✓ Due diligence
Listing remarks MLS
* * * Join Us for Our Spectacular Close Out Event on March 15th! We’re beyond excited to unveil three brand-new plans that you won’t want to miss. Enjoy exclusive incentives and unbeatable pricing promotions during this special event. It’s the perfect opportunity to find your dream plan at an incredible value. Mark your calendars and get ready for an unforgettable experience! * * * Ready for Move-in!! Corner lot! Come fish from our fully stocked 10-acre community pond or the Caloosahatchee River via our community park! * * No Flood Zone * * The Vero floor plan offers superior value at an affordable price. The front yard landscaping invites you to step in and see the beautiful floor plan and interior that awaits. This home is complete with upgrades and features including all new energy-efficient appliances, granite countertops in the kitchen and an open floor plan that will be enjoyed for years to come.
Key facts
- Caloosahatchee river
- Manmade lake
- Boat ramp
Tags
Property features AI
Finance
- Financial info: Pets allowed
- HOA & community: Homeowners association (annual fee $1,800); Association covers street lights; Association amenities: playground, park, management; Community features: boat facilities, non-gated
Exterior
- Parking: Attached 2-car garage; Driveway; Paved parking; Garage door opener
- Security: Smoke detector(s)
- Utilities: Well water; Septic tank; Cable available; High speed internet available; Underground utilities
- Home design: Single-story home; Entry level: 1; Faces south; Resale property; PUD zoning
- Construction: Block, concrete and stucco construction; Shingle roof; Stories: 1
- Exterior features: Patio; Security/high impact doors; Corner lot; North exposure; Public maintained road; Has view
Interior
- Kitchen: Electric cooktop; Range; Microwave; Dishwasher; Refrigerator; Freezer; Icemaker; Pantry
- Bedrooms: Master bedroom (13 x 12); Bedroom (12 x 12); Bedroom (12 x 12)
- Flooring: Carpet; Tile
- Bathrooms: 2 full bathrooms
- Heating & cooling: Central heating (electric); Central air conditioning (electric)
- Interior features: Impact glass windows; Window coverings; Built-in features; Living/dining room; Pantry; Shower only (separate shower); Window treatments; High speed internet; Split bedrooms; Wheelchair access; Unfurnished
- Laundry & utility: Washer; Dryer; Utility room (3 x 3); Laundry inside
Neighborhood map
What this means for you Summary
Snapshot
- This is a 3-bed/2.0-bath single-family listed at $295k.
Deal economics
- At list price, monthly cash flow is $-350 ($-4k/yr) — negative.
- To cash-flow at today's rent, offer at most $233k (21.0% below list).
- To meet the 1% rule (rent ≥ 1% of price), the offer needs to be $232k (21.4% below list).
- Recommended offer: $232k (21.4% below list) — sets the bar for 1% rule.
- Cap rate 4.9% vs local median 3.0% in Fort Denaud — top-decile yield for the area; either an underpriced asset or a hidden risk that comps aren't pricing in. Stress-test before assuming the spread holds.
Location & tenants
- Location reads 65/100 on livability (#635 in FL) — a middle-class / working-renter tenant base. Strengths: crime A+, cost of living A+, housing A+; Watch: amenities F, commute F, health & safety D-.
- Hendry (town): math 35% / reading 40% proficiency, ranked #65 of 73 in FL (top 89%) — families likely to look elsewhere, expect single-tenant / working-renter base with shorter leases; 75% free/reduced lunch — lower-income household profile, screen leases tightly.
- Zoned schools: Labelle Elementary School (math 37% / reading 37%, grade F, #1,609 of 2,144 statewide, top 77%, 437 students, 77% FRL); Labelle Middle School (math 37% / reading 38%, grade F, #395 of 571 statewide, top 70%, 817 students, 72% FRL); Labelle High School (math 42% / reading 41%, grade F, #284 of 667 statewide, top 43%, 1,451 students, 62% FRL).
- Market conditions: 950 active listings in the ZIP; 2 comparable units currently listed for rent nearby; 557 units permitted in Hendry County in 2024 (45 in 5+ unit buildings).
- At $2,318/mo this rent would consume 49% of the median local household income ($57k/yr) (locally 498% of renters already pay >50% of income on rent) — very limited rent-growth headroom before tenants either downsize or default.
Forward outlook
- In year one you build about $32k of equity ($2k loan paydown + $29k appreciation (10.0% local appreciation)).
- Hendry County population projected to shrink 7% by 2050 — rents likely to lag national; underwrite the cash flow, not the appreciation.
- By year 2, paydown + projected appreciation supports a ~$51k cash-out refi (75% LTV) — recoverable capital for the next deal without selling this one.
Negotiation context
- Only 4 days on market — expect competitive offers; lowballing is unlikely to land.
- 6 sale attempts since 5y ago with the ask held roughly flat each time — persistent listings suggest the price (not the market) is what's stuck; bring a comps-based counter.
Risks & watch-outs
- Climate carrying-cost: severe wind risk, 99% chance of damaging wind over 30y; moderate wildfire risk; extreme-heat days projected 7→23/yr by 2055 (HVAC capex compounding) — expect insurance premiums to compound above CPI over the hold.
Questions for the listing agent
- What do current leases actually rent for vs. the listed asking? Can we see a recent rent roll and the last 12 months of T-12 income?
- What does the HOA fee cover, when was the last increase, and are there any pending special assessments or reserve-fund shortfalls?
- Is there a deadline driving the sale (1031 exchange, divorce, estate, relocation)? That informs how much negotiation room exists.
- Schools are F-rated, which usually means shorter tenancies and higher turnover. Who's the typical renter profile here, and what's been the actual vacancy rate?
- The area grade is low — what's the realistic commute time and amenity access for the typical tenant pool here? Any planned neighborhood developments (good or bad) we should know about?
- What's the average days-on-market for RENTAL listings here right now (not sales)? A rising rental-DOM trend means longer vacancies and softer asking-rent achievability than the comps imply.
- What's the recent tenant-quality profile in this submarket — average credit score on applications, eviction rate, late-payment / NSF rate, and stable-employment percentage? A property-management company in the area should have these aggregated.
- How much new for-sale + rental construction is in the pipeline within 1–3 miles? Heavy new supply typically softens prices + rents 12–24 months out; constrained supply supports both.
Investment metrics
- 1% rule
- 0.79% ✗
- Cap rate
- 4.87%
- Cash-on-cash
- -5.09%
- DSCR
- 0.77
- GRM
- 10.6
CMA / ARV
- ARV (on-the-fly)
- $316,000
- Comps found
- 7
Show comp detail 7 sales within ~0.75 mi
| Address | Dist | Beds/Ba | Sqft | Sold | Price | $/sf | Match |
|---|---|---|---|---|---|---|---|
| 936 Admiral Bull Halsey Ave | 0.00mi | 3/2.0 | 1,270 (+0%) | 15mo | $310,900 | $245 | 87 |
| 845 Gen D Macarthur Ave | 0.13mi | 3/2.0 | 1,270 (+0%) | 21mo | $325,000 | $256 | 76 |
| 869 Gen Chesty Puller Ct | 0.15mi | 3/2.0 | 1,270 (+0%) | 22mo | $317,900 | $250 | 74 |
| 860 Gen Chesty Puller Ct | 0.15mi | 3/2.0 | 1,270 (+0%) | 23mo | $325,000 | $256 | 73 |
| 829 Gen Chesty Puller Ct | 0.24mi | 3/2.0 | 1,270 (+0%) | 20mo | $307,900 | $242 | 71 |
| 805 Gen D Macarthur Ave | 0.26mi | 3/2.0 | 1,270 (+0%) | 22mo | $317,900 | $250 | 69 |
| 3555 Ft Denaud Rd | 0.70mi | 3/2.0 | 1,234 (-2%) | 13mo | $325,000 | $263 | 53 |
Match score weights: distance 35% · size 25% · config 20% · recency 20%. Top-matched comps best support the ARV.
Projected returns pro-forma
10.0% appreciation · 3.0% rent growth · sell at horizon
- IRR
- 20.7%
- Equity multiple
- 2.68×
- Total profit
- $138,431
- Equity at exit
- $265,669
- IRR
- 18.8%
- Equity multiple
- 6.15×
- Total profit
- $425,439
- Equity at exit
- $572,926
Cash invested: $82,572 (down + closing). Projections, not guarantees.
Landlord ↔ Tenant lean methodology
- Overall (STATE)
- 87 Strongly Landlord-Friendly
- State Florida
- 87 Strongly Landlord-Friendly · R+3
- County
- — inherits STATE
- City
- — inherits STATE
ZIP-level market 33935
- Home prices YoY
- 16.3%
- Active inventory
- 950
- Price-to-rent
- 10.6×
Monthly cashflow live
- Estimated rent
- $2,318 medium interval (Pro) →
- Mortgage (P&I)
- −$1,546
- Tax from tax record
- −$362 /mo · $4,344/yr
- Insurance
- −$123
- HOA
- −$150
- Vacancy / Maint / Mgmt
- −$487
- Net cashflow
- $-350
Break-even live
Sensitivity live
| Price | -10% $-183 | -5% $-267 | +0% $-350 | +5% $-434 | +10% $-517 |
|---|---|---|---|---|---|
| Rent | -10% $-533 | -5% $-442 | +0% $-350 | +5% $-259 | +10% $-167 |
| Rate | -1.0pp $-202 | -0.5pp $-275 | base $-350 | +0.5pp $-427 | +1.0pp $-504 |
UW: 25.0% down · 7.5% · 30yr · 1.5% tax · 5.0% vac · 8.0% maint · 8.0% mgmt
Financing live
Cash to close
- Down payment
- $73,725
- Closing costs
- $8,847
- Reserves months
- —
- Total cash needed
- —
Loan-product check · same deal, 3 products live
Conventional
25% down · 7.5% · 30yr
- Down + closing
- —
- Monthly P&I
- —
- Monthly cashflow
- —
- DSCR
- —
- Eligible?
- —
Personal DTI + credit; lowest rate.
DSCR
20% down · 8.5% · 30yr
- Down + closing
- —
- Monthly P&I
- —
- Monthly cashflow
- —
- DSCR
- —
- Eligible?
- —
No personal income docs; deal must DSCR.
Hard money
10% down · 12.0% · 12mo
- Down + closing
- —
- Monthly P&I
- —
- Monthly cashflow
- —
- DSCR
- —
- Eligible?
- —
Short-term bridge; refi at stabilization.
Rent comps 2 comps
| Address | Beds | Baths | Sqft | Rent | $/sqft | DOM | Units | Dist |
|---|---|---|---|---|---|---|---|---|
| 985 Quail Run Fort Denaud, FL | 2.0 | 2.0 | 1748 | $2,000 | $1.14 | 25d | 1 | 0.15mi |
| 1024 Caloosa Breeze Dr Labelle, FL | 4.0 | 2.0 | 1480 | $2,100 | $1.42 | 25d | 1 | 1.28mi |
HOA detail
- Monthly dues
- $150 · $1,800/yr
- Likely covers
- landscaping
Listing history 3 events
-
2026-06-22days on market $294,900 Active 4 DOM
-
2026-06-17remarks 699-char remark
-
2026-06-17$294,900 Active 1 DOM
ⓘ Source: listings_history table (triggers on properties + properties_extension) + one-shot
backfill from property_details.listing_events for pre-trigger history.
Tax reassessment forecast FL · Resets to sale price
- Current annual tax
- $4,344 · $362/mo
- Projected year-2 tax
- $4,344 · $362/mo
- Expected delta
- $0/yr ($0/mo · 0.0%)
ⓘ Screening estimate from a state-policy table — verify with the county assessor before closing.
Climate risk First Street
- Flood 1/10 Low FEMA zone X (unshaded) · 0% chance over 30 yrs
- Wildfire 5/10 Major
- Heat 9/10 Extreme 7 d/yr ≥109°F today · 23 d/yr by 30 yrs out
- Wind 10/10 Extreme 99% chance of damaging wind over 30 yrs
- Air quality 1/10 Low 0 unhealthy d/yr today · 0 by 30 yrs out
Nearby sold comps map
Loading sold comps map…
Walkable amenities ~0.75 mi
Loading nearby amenities…
Taxation est. · year 1
- Rental income
- $27,816
- − Mortgage interest
- −$16,519
- − Property taxes
- −$4,344
- − Insurance
- −$1,474
- − Repairs & maintenance
- −$2,225
- − Management
- −$2,225
- − HOA
- −$1,800
- − Depreciation
- −$8,579
- Taxable loss
- −$9,351
- Est. tax savings @ 24.0%
- +$2,244
- After-tax cash flow
- $-1,958/yr
For passive investors: Depreciation is non-cash, so a rental often shows a tax loss while cash-flowing — sheltering income. Rental losses are passive: they offset passive income freely, and up to $25,000/yr can offset ordinary (W-2) income if you actively participate and your MAGI is under $100k (phasing out to $0 by $150k); unused losses carry forward. On sale, claimed depreciation is recaptured at up to 25%, and gains may owe capital-gains tax (a 1031 exchange can defer both). Figures are a year-1 estimate at your 24.0% rate — not tax advice; consult a CPA.
Schools (NCES district)
- District
- Hendry
- NCES district ID
- 1200780
- Math proficiency
- 35% ▼ -11.00%
- Reading proficiency
- 40% ▼ -4.00%
- Median HH income
- $37,043
- Composite
- 31.16/100
- National rank
- #6054
- State rank
- #65 of 73 in FL
Livability — Fort Denaud
- Score
- 65/100
- State rank
- #635
- US rank
- #12451
Category grades
Schools grade is shown separately in the Schools card above.
Census & demographics
- Census place
- Fort Denaud, FL
- County
- Hendry County · 23,186 people
- Metro
- Clewiston, FL
- Population (ZIP)
- 23,186
- Household income
- $57,009
- Rent vs Own
- Severe rent burden
- 498.0
Population outlook (Hendry County) Hauer SSP2
- Today (2025)
- 38,866 people
- By 2030
- 38,558 · -0.8%
- By 2040
- 37,743 · -2.9%
- By 2050
- 36,117 · -7.1%
- By 2075
- 30,070 · -22.6%
- By 2100
- 21,966 · -43.5%
Race, ethnicity, and origin ACS 2023
- Neighborhood character
- Majority Hispanic (56%)
- Race & ethnicity
- Hispanic / Latino 56% White 39% Two or more races 21% Black 2% Native American 2%
- Hispanic origin (detail)
- Mexican 40% Puerto Rican 3% Cuban 5%
- Common ancestry
- Lithuanian 2% Serbian 2% Slovak 1%
- Foreign-born
- 27% · Canada, Jamaica
- Languages at home
- 50% English-only · Spanish 50%
Political lean MEDSL · Hendry
- 2024 margin
- Solid R (+38.3) · D 30.4% · R 68.7%
- 2008→2024 swing
- -31.1pp toward R · 2008: -7.2pp · 2024: -38.3pp
- All cycles
- 2024: R+38.3 2020: R+23.0 2016: R+14.2 2012: R+5.9 2008: R+7.2
Not yet ingested
- Civics
- —
Market trends
- HPI YoY
- ▲ 75.20%
- Current HPI
- 537.4928
- Rent YoY
- —
- Metro
- Clewiston, FL
- State GDP YoY
- ▲ 3.28%
- F500 in state
- 36
Industry mix (Fortune 500 HQ in FL)
| Industry | F500 HQs | Revenue |
|---|---|---|
| Industrial Technology | 2 | $29B |
|
||
| Insurance | 2 | $17B |
|
||
| Retail | 1 | $60B |
|
||
| Technology Distribution | 1 | $58B |
|
||
| Homebuilding | 1 | $35B |
|
||
| Technology Manufacturing | 1 | $35B |
|
||
Price history
-8.7% since first listed28 events — show timeline
- 2026-06-12 Listed $294,900 FORTMLS
- 2025-10-17 Rental Removed $1,750 BUILDIUM
- 2025-08-22 Price Changed $1,750 BUILDIUM
- 2025-08-10 Price Changed $1,799 BUILDIUM
- 2025-06-23 Price Changed $1,995 BUILDIUM
- 2025-05-01 Listed for Rent $2,100 BUILDIUM
- 2025-04-11 Pending — FORTMLS
- 2025-04-08 Sold (Public Records) $310,857 Public Records
- 2025-04-04 Sold (MLS) $310,900 FORTMLS
- 2025-02-05 Relisted — FORTMLS
- 2025-01-31 Pending — FORTMLS
- 2025-01-03 Price Changed $341,900 FORTMLS
- 2024-11-19 Relisted — FORTMLS
- 2024-11-18 Pending — FORTMLS
- 2024-11-14 Price Changed $331,900 FORTMLS
- 2024-10-22 Price Changed $337,900 FORTMLS
- 2024-10-22 Price Changed $333,900 FORTMLS
- 2024-10-11 Price Changed $331,900 FORTMLS
- 2024-10-03 Price Changed $337,900 FORTMLS
- 2024-09-25 Relisted — FORTMLS
- 2024-09-23 Pending — FORTMLS
- 2024-08-28 Price Changed $333,900 FORTMLS
- 2024-07-08 Price Changed $317,900 FORTMLS
- 2024-07-06 Price Changed $333,900 FORTMLS
- 2024-07-02 Price Changed $317,900 FORTMLS
- 2024-06-07 Price Changed $333,900 FORTMLS
- 2024-04-24 Price Changed $332,900 FORTMLS
- 2021-04-19 Listed $322,900 FORTMLS
Property tax history
+119.1%/yrLatest (2025): $4,344 · -13.3% YoY. Source: county tax records.
Cash-flow waterfall
monthlySold comps — $/sqft
last 12 mo · ≤1 miLoading sold comps…