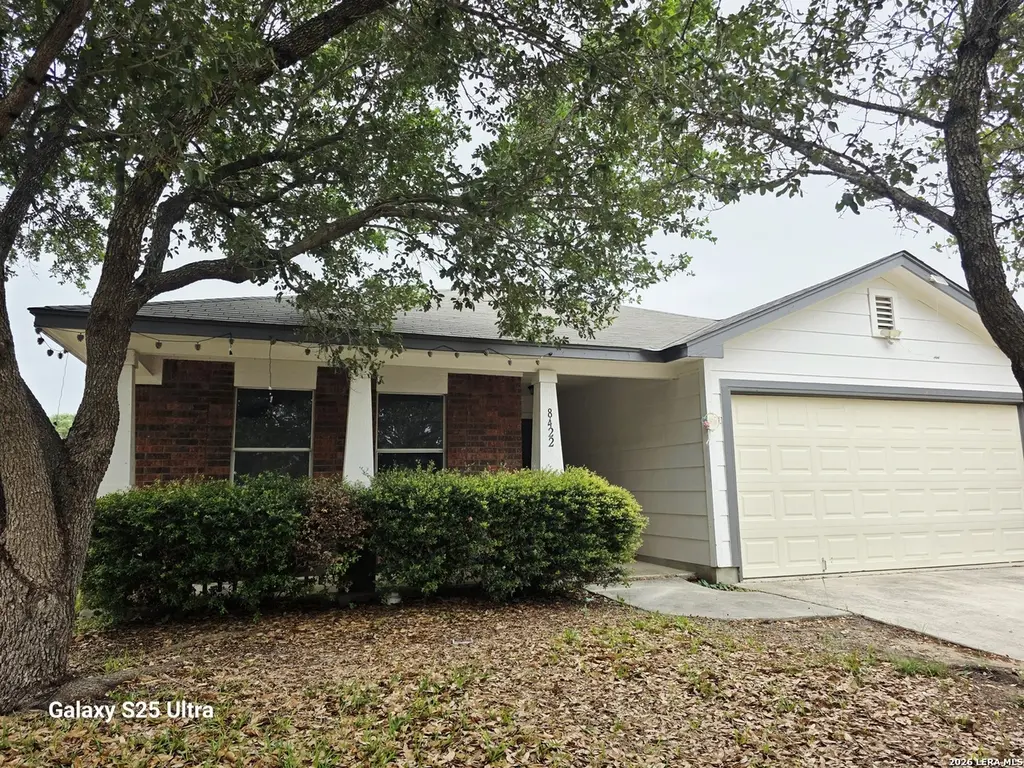
8422 Trumpet
San Antonio, TX 78109
$209,900D-
3 bd · 2.5 ba ·
1,778 sqft ·
Built 2005
· SingleFamily
· Active
· 61 DOM
Cashflow @ list (25.0% down · 7.5%)
Estimated rent
$1,822/mo
Mortgage (P&I)
−$1,101
Tax + insurance
−$491
HOA
−$23
Vac / Maint / Mgmt
−$383
Net cashflow
$-176/mo
Annual
$-2,110/yr
Cap rate
5.29%
Cash-on-cash
-3.59%
DSCR
0.84
1% rule
0.87%
Cash to close
$58,772
Investor read
- This is a 3-bed/2.5-bath single-family listed at $210k.
- At list price, monthly cash flow is $-176 ($-2k/yr) — negative.
- To cash-flow at today's rent, offer at most $179k (14.8% below list).
- To meet the 1% rule (rent ≥ 1% of price), the offer needs to be $182k (13.2% below list).
- It's been on market 61 days — a 6% lower offer ($197k) is reasonable based on typical stale-listing flexibility.
- Recommended offer: $179k (14.8% below list) — sets the bar for cash-flow.
- Local home prices are declining (-3.0%/yr); year-one equity from $1k of loan paydown is wiped out by about $6k of value loss. Plan a longer hold.
- Location reads 80/100 on livability (#31 in TX, #1,616 nationally) — a professional / high-income tenant draw. Strengths: amenities A+, commute A+, cost of living A+; Watch: schools C-, crime F.
- Judson ISD (suburban): math 21% / reading 33% proficiency, ranked #660 of 826 in TX (top 80%) — low school quality limits family demand, transient renter base, plan for 1-2y turnover.
- Market conditions: Rents soft (-1.1%/yr); 1152 active listings in the ZIP; 40 comparable units currently listed for rent nearby; rentals at typical pace (median 20d on market — plan ~3-4 weeks tenant-placement turnaround); solid renter incomes; 8,308 units permitted in Bexar County in 2024 (2,506 in 5+ unit buildings).
- Bexar County population projected at +50% by 2050 — long-run rental-demand tailwind backs the buy-and-hold thesis.
- 2 sale attempts since 8y ago with the ask held roughly flat each time — persistent listings suggest the price (not the market) is what's stuck; bring a comps-based counter.
- Climate carrying-cost: severe wind risk, 80% chance of damaging wind over 30y; extreme-heat days projected 7→23/yr by 2055 (HVAC capex compounding) — expect insurance premiums to compound above CPI over the hold.
- Cap rate 5.3% vs local median 3.8% in San Antonio — top-decile yield for the area; either an underpriced asset or a hidden risk that comps aren't pricing in. Stress-test before assuming the spread holds.
Questions for listing agent
- What do current leases actually rent for vs. the listed asking? Can we see a recent rent roll and the last 12 months of T-12 income?
- It's been on market 61 days. Have you received any prior offers? Is the seller open to a 15% concession, seller financing, or rate buy-down credit?
- What does the HOA fee cover, when was the last increase, and are there any pending special assessments or reserve-fund shortfalls?
- Why hasn't it sold? Are there any deal-killer items the seller is aware of (foundation, flood, title, zoning, code violations)?
- Is there a deadline driving the sale (1031 exchange, divorce, estate, relocation)? That informs how much negotiation room exists.
- Crime grade is F in this area — have there been break-ins, vandalism, or insurance claims at this property in the last 3 years? What carrier currently insures it and at what premium?
- The area grade is low — what's the realistic commute time and amenity access for the typical tenant pool here? Any planned neighborhood developments (good or bad) we should know about?
- What's the average days-on-market for RENTAL listings here right now (not sales)? A rising rental-DOM trend means longer vacancies and softer asking-rent achievability than the comps imply.
CashFlowRE · CFR-9RSDCM939TC8JF
· Data 2 days ago
cashflowre.app · 2026-05-29