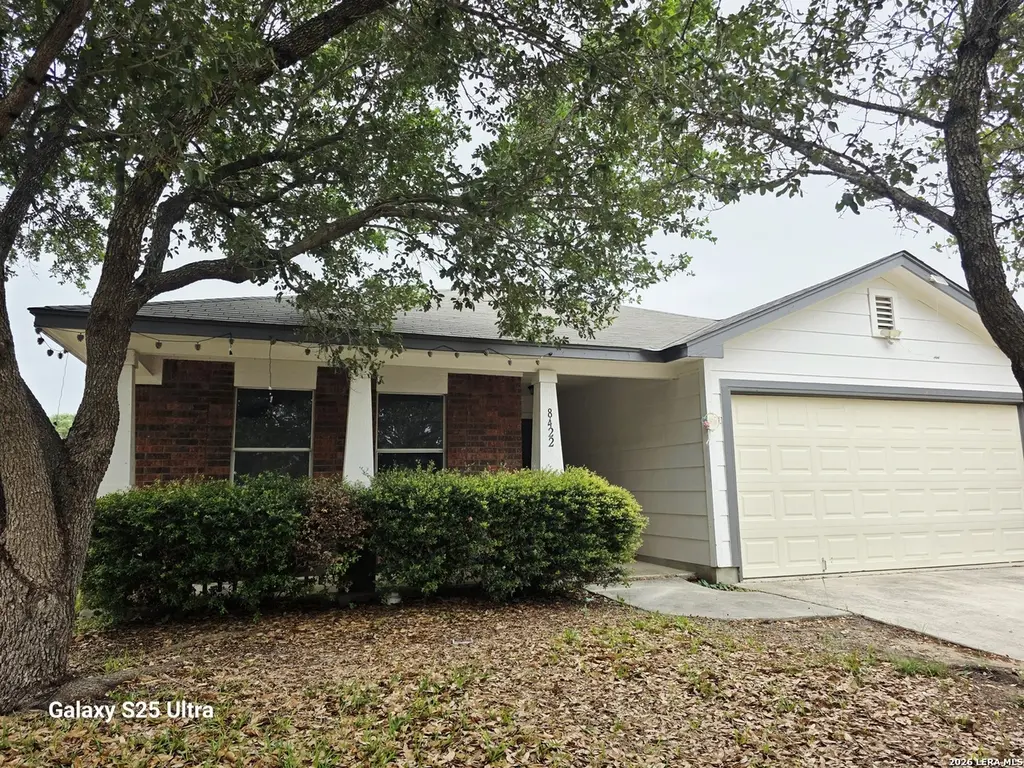
8422 Trumpet · San Antonio, TX
Flood risk 1/10 · Minimal
- FEMA flood zone
- X (unshaded)
- Chance of flooding over 30 yrs
- 0.0%
- Est. flood insurance / yr
- $507 – $1,088
Fire risk 4/10 · Minor
- Est. fire insurance / yr
- $1,222 – $2,270
Heat risk 8/10 · Major
- Hot days now (above 108°F)
- 7 days/yr
- Hot days in 30 yrs
- 23 days/yr
Wind risk 8/10 · Major
- Chance of severe wind over 30 yrs
- 80.0%
Air-quality risk 1/10 · Minimal
- Unhealthy air days now
- 0 days/yr
- Unhealthy air days in 30 yrs
- 0 days/yr
Risk factors via First Street. Map © Google.
Why this score? — see what drove the D- grade
The composite is a weighted blend of 9 inputs, each scored 0–100. Each bar is that input's sub-score; the figure is the points it added to the 100-point composite (weight × sub-score).
- ARV discount +13.9/15.0
- Cash flow +8.7/30.0
- Livability +4.0/5.0
- 1% rule +3.7/10.0
- Condition / age +2.5/5.0
- DSCR +2.4/10.0
- Schools +2.4/10.0
- Rent growth +2.2/5.0
- Appreciation +0.0/10.0
$209,900
🖨 Deal sheet 📄 Offer letter ✓ Due diligence
Listing remarks MLS
Selling in AS-IS condition! Incredible value on this 4-bedroom, 2-bath home-priced under market value. With a few cosmetic touches, this home truly shines. Long-term rental property with consistent occupancy. Perfect for investors or owner-occupants-this is an opportunity you don't want to miss.
Key facts
- 6,011 sq ft lot
- 2 garage spots
- Community pool
Neighborhood map
What this means for you Summary
Snapshot
- This is a 3-bed/2.5-bath single-family listed at $210k.
Deal economics
- At list price, monthly cash flow is $-176 ($-2k/yr) — negative.
- To cash-flow at today's rent, offer at most $179k (14.8% below list).
- To meet the 1% rule (rent ≥ 1% of price), the offer needs to be $182k (13.2% below list).
- Recommended offer: $179k (14.8% below list) — sets the bar for cash-flow.
- Cap rate 5.3% vs local median 3.8% in San Antonio — top-decile yield for the area; either an underpriced asset or a hidden risk that comps aren't pricing in. Stress-test before assuming the spread holds.
Location & tenants
- Location reads 80/100 on livability (#31 in TX, #1,616 nationally) — a professional / high-income tenant draw. Strengths: amenities A+, commute A+, cost of living A+; Watch: schools C-, crime F.
- Judson ISD (suburban): math 21% / reading 33% proficiency, ranked #660 of 826 in TX (top 80%) — low school quality limits family demand, transient renter base, plan for 1-2y turnover.
- Market conditions: Rents soft (-1.1%/yr); 1152 active listings in the ZIP; 40 comparable units currently listed for rent nearby; rentals at typical pace (median 20d on market — plan ~3-4 weeks tenant-placement turnaround); solid renter incomes; 8,308 units permitted in Bexar County in 2024 (2,506 in 5+ unit buildings).
Forward outlook
- Local home prices are declining (-3.0%/yr); year-one equity from $1k of loan paydown is wiped out by about $6k of value loss. Plan a longer hold.
- Bexar County population projected at +50% by 2050 — long-run rental-demand tailwind backs the buy-and-hold thesis.
Negotiation context
- It's been on market 61 days — a 6% lower offer ($197k) is reasonable based on typical stale-listing flexibility.
- 2 sale attempts since 8y ago with the ask held roughly flat each time — persistent listings suggest the price (not the market) is what's stuck; bring a comps-based counter.
Risks & watch-outs
- Climate carrying-cost: severe wind risk, 80% chance of damaging wind over 30y; extreme-heat days projected 7→23/yr by 2055 (HVAC capex compounding) — expect insurance premiums to compound above CPI over the hold.
Questions for the listing agent
- What do current leases actually rent for vs. the listed asking? Can we see a recent rent roll and the last 12 months of T-12 income?
- It's been on market 61 days. Have you received any prior offers? Is the seller open to a 15% concession, seller financing, or rate buy-down credit?
- What does the HOA fee cover, when was the last increase, and are there any pending special assessments or reserve-fund shortfalls?
- Why hasn't it sold? Are there any deal-killer items the seller is aware of (foundation, flood, title, zoning, code violations)?
- Is there a deadline driving the sale (1031 exchange, divorce, estate, relocation)? That informs how much negotiation room exists.
- Crime grade is F in this area — have there been break-ins, vandalism, or insurance claims at this property in the last 3 years? What carrier currently insures it and at what premium?
- The area grade is low — what's the realistic commute time and amenity access for the typical tenant pool here? Any planned neighborhood developments (good or bad) we should know about?
- What's the average days-on-market for RENTAL listings here right now (not sales)? A rising rental-DOM trend means longer vacancies and softer asking-rent achievability than the comps imply.
- What's the recent tenant-quality profile in this submarket — average credit score on applications, eviction rate, late-payment / NSF rate, and stable-employment percentage? A property-management company in the area should have these aggregated.
- How much new for-sale + rental construction is in the pipeline within 1–3 miles? Heavy new supply typically softens prices + rents 12–24 months out; constrained supply supports both.
Investment metrics
- 1% rule
- 0.87% ✗
- Cap rate
- 5.29%
- Cash-on-cash
- -3.59%
- DSCR
- 0.84
- GRM
- 9.6
CMA / ARV
- ARV (median comp)
- $244,946
- List price
- $209,900
- Delta
- -14.31%
- Verdict
- UNDERPRICED
- Comps
- 20 within 1.0 mi
Show comp detail 12 sales within ~0.75 mi
| Address | Dist | Beds/Ba | Sqft | Sold | Price | $/sf | Match |
|---|---|---|---|---|---|---|---|
| 8423 Snakeweed Dr | 0.09mi | 3/2.0 | 1,668 (-6%) | 3mo | $245,000 | $147 | 81 |
| 4447 Tivoli | 0.41mi | 3/2.5 | 1,772 (-0%) | 3mo | $240,000 | $135 | 78 |
| 3845 Mistflower | 0.13mi | 4/2.5 (+1) | 1,934 (+9%) | 0mo | $229,990 | $119 | 74 |
| 4102 Texas Palm Dr | 0.12mi | 4/2.5 (+1) | 1,941 (+9%) | 2mo | $250,000 | $129 | 72 |
| 8619 Key North | 0.45mi | 3/2.5 | 1,701 (-4%) | 3mo | $184,777 | $109 | 70 |
| 3914 Bacall Way | 0.39mi | 3/2.0 | 1,903 (+7%) | 3mo | $279,900 | $147 | 66 |
| 3963 Bacall | 0.44mi | 3/2.0 | 1,654 (-7%) | 2mo | $264,900 | $160 | 64 |
| 8411 Favero Cv | 0.57mi | 4/2.0 (+1) | 1,742 (-2%) | 4mo | $195,720 | $112 | 60 |
| 8819 Trumpet | 0.27mi | 4/2.0 (+1) | 1,550 (-13%) | 1mo | $217,500 | $140 | 58 |
| 7927 Hatchmere | 0.59mi | 3/2.0 | 1,656 (-7%) | 1mo | $249,999 | $151 | 58 |
| 4838 Via Sonoma Trl | 0.69mi | 3/2.5 | 1,611 (-9%) | 1mo | $260,000 | $161 | 52 |
| 8706 Joshua Tree | 0.66mi | 3/2.5 | 2,031 (+14%) | 1mo | $250,000 | $123 | 45 |
Match score weights: distance 35% · size 25% · config 20% · recency 20%. Top-matched comps best support the ARV.
Projected returns pro-forma
-3.0% appreciation · 0.0% rent growth · sell at horizon
- IRR
- -26.1%
- Equity multiple
- 0.14×
- Total profit
- $-50,421
- Equity at exit
- $31,297
- IRR
- -39.6%
- Equity multiple
- -0.33×
- Total profit
- $-78,435
- Equity at exit
- $18,148
Cash invested: $58,772 (down + closing). Projections, not guarantees.
Landlord ↔ Tenant lean methodology
- Overall (STATE)
- 87 Strongly Landlord-Friendly
- State Texas
- 87 Strongly Landlord-Friendly · R+5
- County
- — inherits STATE
- City
- — inherits STATE
ZIP-level market 78109
- Home prices YoY
- -17.8%
- Rents YoY
- -1.1%
- Active inventory
- 1152
- Price-to-rent
- 9.6×
Monthly cashflow live
- Estimated rent
- $1,822 high interval (Pro) →
- Mortgage (P&I)
- −$1,101
- Tax from tax record
- −$404 /mo · $4,847/yr
- Insurance
- −$87
- HOA
- −$23
- Vacancy / Maint / Mgmt
- −$383
- Net cashflow
- $-176
Break-even live
UW: 25.0% down · 7.5% · 30yr · 1.5% tax · 5.0% vac · 8.0% maint · 8.0% mgmt
Financing live
Cash to close
- Down payment
- $52,475
- Closing costs
- $6,297
- Reserves months
- —
- Total cash needed
- —
Loan-product check · same deal, 3 products live
Conventional
25% down · 7.5% · 30yr
- Down + closing
- —
- Monthly P&I
- —
- Monthly cashflow
- —
- DSCR
- —
- Eligible?
- —
Personal DTI + credit; lowest rate.
DSCR
20% down · 8.5% · 30yr
- Down + closing
- —
- Monthly P&I
- —
- Monthly cashflow
- —
- DSCR
- —
- Eligible?
- —
No personal income docs; deal must DSCR.
Hard money
10% down · 12.0% · 12mo
- Down + closing
- —
- Monthly P&I
- —
- Monthly cashflow
- —
- DSCR
- —
- Eligible?
- —
Short-term bridge; refi at stabilization.
Rent comps 40 comps
| Address | Beds | Baths | Sqft | Rent | $/sqft | DOM | Units | Dist |
|---|---|---|---|---|---|---|---|---|
| 8423 Snakeweed Dr Unit 1 Converse, TX | 3.0 | 2.0 | 1668 | $1,500 | $0.90 | 43d | 1 | 0.07mi |
| 8514 Whitebrush Converse, TX | 3.0 | 2.0 | 1535 | $1,700 | $1.11 | 23d | 1 | 0.08mi |
| 8531 Rita Blanca St Converse, TX | 4.0 | 2.5 | 1941 | $1,700 | $0.88 | 14d | 1 | 0.14mi |
| 8519 Snakeweed Dr Converse, TX | 3.0 | 2.0 | 1259 | $1,450 | $1.15 | 12d | 1 | 0.14mi |
| 8422 Cherisse Dr Converse, TX | 3.0 | 2.0 | 1436 | $1,736 | $1.21 | 4d | 1 | 0.23mi |
| 8611 Key Windy Way Unit 2 Converse, TX | 3.0 | 2.5 | 1514 | $1,850 | $1.22 | 43d | 1 | 0.26mi |
| 8611 Key Windy Way Unit 2 Converse, TX | 3.0 | 2.5 | 1514 | $1,850 | $1.22 | 2d | 1 | 0.26mi |
| 8215 Torchwood Dr Converse, TX | 4.0 | 2.0 | 1958 | $1,900 | $0.97 | 43d | 1 | 0.28mi |
| 8411 Crinum Lily Dr Converse, TX | 3.0 | 2.0 | 1259 | $1,550 | $1.23 | 23d | 1 | 0.31mi |
| 8639 Key Windy Way Converse, TX | 3.0 | 2.5 | 1225 | $1,475 | $1.20 | 4d | 1 | 0.33mi |
| 8639 Key Windy Way Unit 1 Converse, TX | 3.0 | 2.5 | 1225 | $1,475 | $1.20 | 23d | 1 | 0.33mi |
| 3922 West Way Key W Converse, TX | 3.0 | 2.0 | 1981 | $2,300 | $1.16 | 4d | 1 | 0.35mi |
| 3947 West Way Key W Converse, TX | 4.0 | 2.5 | 2338 | $1,936 | $0.83 | 2d | 1 | 0.38mi |
| 4330 Gambels Quail Converse, TX | 3.0 | 2.5 | 2240 | $1,695 | $0.76 | 23d | 1 | 0.40mi |
| 4660 Via Sonoma Trl Converse, TX | 3.0 | 2.5 | 2098 | $1,900 | $0.91 | 43d | 1 | 0.54mi |
| 4315 Roundhay Park Converse, TX | 3.0 | 2.0 | 1976 | $2,800 | $1.42 | 23d | 1 | 0.58mi |
| 8411 Favero Cv Converse, TX | 4.0 | 2.0 | 1668 | $1,695 | $1.02 | 43d | 1 | 0.59mi |
| 4931 Badland Beacon Converse, TX | 3.0 | 2.0 | 1509 | $1,625 | $1.08 | 43d | 1 | 0.68mi |
| 4746 Gambels Quail Converse, TX | 3.0 | 2.5 | 2214 | $1,695 | $0.77 | 2d | 1 | 0.69mi |
| 8902 Grand Western Converse, TX | 3.0 | 2.5 | 1570 | $1,995 | $1.27 | 43d | 1 | 0.78mi |
| 9110 Longhorn Park Converse, TX | 3.0 | 2.0 | 1646 | $1,675 | $1.02 | 12d | 1 | 0.81mi |
| 9110 Longhorn Park Converse, TX | 3.0 | 2.0 | 1646 | $1,675 | $1.02 | 16d | 1 | 0.81mi |
| 9026 Bowring Park Converse, TX | 3.0 | 2.0 | 1721 | $1,795 | $1.04 | 43d | 1 | 0.83mi |
| 5118 Everett Loop Converse, TX | 4.0 | 2.0 | 1635 | $1,599 | $0.98 | 14d | 1 | 0.84mi |
| 8511 Cassia Cv Converse, TX | 3.0 | 2.0 | 1910 | $1,700 | $0.89 | 43d | 1 | 0.85mi |
| 8907 Arundal Gdn Converse, TX | 3.0 | 2.0 | 1921 | $1,895 | $0.99 | 17d | 1 | 0.86mi |
| 7703 Redstone Mnr Converse, TX | 3.0 | 2.0 | 1656 | $1,750 | $1.06 | 23d | 1 | 0.87mi |
| 8931 Arundal Gdn Converse, TX | 4.0 | 2.5 | 2507 | $2,300 | $0.92 | 12d | 1 | 0.88mi |
| 8907 Ladbroke Grv Converse, TX | 3.0 | 2.0 | 1921 | $1,900 | $0.99 | 2d | 1 | 0.90mi |
| 8511 Amistad Cv Converse, TX | 3.0 | 2.0 | 1440 | $1,479 | $1.03 | 4d | 1 | 0.91mi |
| 4126 Stanley Park Converse, TX | 4.0 | 2.5 | 2514 | $1,945 | $0.77 | 43d | 1 | 0.91mi |
| 8555 Barefoot Ln Converse, TX | 3.0 | 2.5 | 1780 | $2,050 | $1.15 | 23d | 1 | 0.96mi |
| 4326 Stanley Park Converse, TX | 3.0 | 2.0 | 1484 | $1,650 | $1.11 | 2d | 1 | 0.96mi |
| 7715 Shining Glow San Antonio, TX | 3.0 | 2.5 | 1554 | $1,529 | $0.98 | 16d | 1 | 0.96mi |
| 7715 Shining Glow San Antonio, TX | 3.0 | 2.5 | 1554 | $1,499 | $0.96 | 3d | 1 | 0.96mi |
| 4807 Marylebone Ave Converse, TX | 4.0 | 2.5 | 2032 | $2,200 | $1.08 | 43d | 1 | 0.99mi |
| 7718 Burro Bnd San Antonio, TX | 3.0 | 2.5 | 1547 | $1,650 | $1.07 | 3d | 1 | 1.01mi |
| 5475 Bluebell Mdw Converse, TX | 3.0 | 2.5 | 1605 | $1,695 | $1.06 | 43d | 1 | 1.02mi |
| 9231 Yaya Rd Converse, TX | 4.0 | 2.5 | 2329 | $2,150 | $0.92 | 20d | 1 | 1.02mi |
| 7923 Horse Holw San Antonio, TX | 3.0 | 2.0 | 1916 | $1,599 | $0.83 | 2d | 1 | 1.03mi |
HOA detail
- Monthly dues
- $23 · $276/yr
Listing history 20 events
-
2026-06-18days on market $209,900 Active 61 DOM
-
2026-06-17days on market $209,900 Active 60 DOM
-
2026-06-16days on market $209,900 Active 59 DOM
-
2026-06-15days on market $209,900 Active 58 DOM
-
2026-06-13days on market $209,900 Active 56 DOM
-
2026-06-09days on market $209,900 Active 52 DOM
-
2026-06-08days on market $209,900 Active 51 DOM
-
2026-06-07days on market $209,900 Active 50 DOM
-
2026-06-04days on market $209,900 Active 47 DOM
-
2026-06-03days on market $209,900 Active 46 DOM
-
2026-06-02days on market $209,900 Active 45 DOM
-
2026-06-01days on market $209,900 Active 44 DOM
-
2026-05-31days on market $209,900 Active 43 DOM
-
2026-05-13price $209,900 296-char remark
Show marketing remark (296 chars)
Selling in AS-IS condition! Incredible value on this 4-bedroom, 2-bath home-priced under market value. With a few cosmetic touches, this home truly shines. Long-term rental property with consistent occupancy. Perfect for investors or owner-occupants-this is an opportunity you don't want to miss.
-
2026-04-18$218,900 New 296-char remark
Show marketing remark (296 chars)
Selling in AS-IS condition! Incredible value on this 4-bedroom, 2-bath home-priced under market value. With a few cosmetic touches, this home truly shines. Long-term rental property with consistent occupancy. Perfect for investors or owner-occupants-this is an opportunity you don't want to miss.
-
2019-01-07soldstatus
-
2019-01-04soldstatus Sold 284-char remark
Show marketing remark (284 chars)
Investors Only! Do not disturb the tenants. Beautiful very well maintained single story home in Escondido Creek. Great open floor plan with high ceilings in living area. 4 bedrooms split. Kitchen has gas stove. Sprinkler system included. Excellent investment potential. Drive by only.
-
2018-12-18status Pending 284-char remark
Show marketing remark (284 chars)
Investors Only! Do not disturb the tenants. Beautiful very well maintained single story home in Escondido Creek. Great open floor plan with high ceilings in living area. 4 bedrooms split. Kitchen has gas stove. Sprinkler system included. Excellent investment potential. Drive by only.
-
2018-12-07historical Active Option 284-char remark
Show marketing remark (284 chars)
Investors Only! Do not disturb the tenants. Beautiful very well maintained single story home in Escondido Creek. Great open floor plan with high ceilings in living area. 4 bedrooms split. Kitchen has gas stove. Sprinkler system included. Excellent investment potential. Drive by only.
-
2018-11-24$157,000 New 284-char remark
Show marketing remark (284 chars)
Investors Only! Do not disturb the tenants. Beautiful very well maintained single story home in Escondido Creek. Great open floor plan with high ceilings in living area. 4 bedrooms split. Kitchen has gas stove. Sprinkler system included. Excellent investment potential. Drive by only.
ⓘ Source: listings_history table (triggers on properties + properties_extension) + one-shot
backfill from property_details.listing_events for pre-trigger history.
Tax reassessment forecast TX · Resets to sale price
- Current annual tax
- $4,847 · $404/mo
- Projected year-2 tax
- $4,847 · $404/mo
- Expected delta
- $0/yr ($0/mo · 0.0%)
ⓘ Screening estimate from a state-policy table — verify with the county assessor before closing.
Climate risk First Street
- Flood 1/10 Low FEMA zone X (unshaded) · 0% chance over 30 yrs
- Wildfire 4/10 Moderate
- Heat 8/10 Severe 7 d/yr ≥108°F today · 23 d/yr by 30 yrs out
- Wind 8/10 Severe 80% chance of damaging wind over 30 yrs
- Air quality 1/10 Low 0 unhealthy d/yr today · 0 by 30 yrs out
Nearby sold comps map
Loading sold comps map…
Walkable amenities ~0.75 mi
Loading nearby amenities…
Taxation est. · year 1
- Rental income
- $21,862
- − Mortgage interest
- −$11,758
- − Property taxes
- −$4,847
- − Insurance
- −$1,050
- − Repairs & maintenance
- −$1,749
- − Management
- −$1,749
- − HOA
- −$276
- − Depreciation
- −$6,106
- Taxable loss
- −$5,672
- Est. tax savings @ 24.0%
- +$1,361
- After-tax cash flow
- $-749/yr
For passive investors: Depreciation is non-cash, so a rental often shows a tax loss while cash-flowing — sheltering income. Rental losses are passive: they offset passive income freely, and up to $25,000/yr can offset ordinary (W-2) income if you actively participate and your MAGI is under $100k (phasing out to $0 by $150k); unused losses carry forward. On sale, claimed depreciation is recaptured at up to 25%, and gains may owe capital-gains tax (a 1031 exchange can defer both). Figures are a year-1 estimate at your 24.0% rate — not tax advice; consult a CPA.
Schools (NCES district)
- District
- Judson ISD
- NCES district ID
- 4824990
- Math proficiency
- 21% ▼ -21.00%
- Reading proficiency
- 33% ▼ -7.00%
- Median HH income
- $57,542
- Composite
- 24.39/100
- National rank
- #7689
- State rank
- #660 of 826 in TX
Livability — San Antonio
- Score
- 80/100
- State rank
- #31
- US rank
- #1616
Category grades
Schools grade is shown separately in the Schools card above.
Census & demographics
- County
- Bexar County · 1,990,555 people
- City population
- 1,806,925
- Metro
- San Antonio-New Braunfels, TX
- Population (ZIP)
- 63,067
- Household income
- $91,320
- Rent vs Own
- Severe rent burden
- 1732.0
Population outlook (Bexar County) Hauer SSP2
- Today (2025)
- 2,336,851 people
- By 2030
- 2,560,728 · +9.6%
- By 2040
- 3,020,569 · +29.3%
- By 2050
- 3,493,522 · +49.5%
- By 2075
- 4,668,459 · +99.8%
- By 2100
- 5,533,242 · +136.8%
Race, ethnicity, and origin ACS 2023
- Neighborhood character
- Diverse neighborhood (Simpson 0.69)
- Race & ethnicity
- Hispanic / Latino 44% White 27% Two or more races 21% Black 21% Asian 3%
- Hispanic origin (detail)
- Mexican 29% Puerto Rican 4%
- Common ancestry
- Lithuanian 1% Romanian 1% Italian 1%
- Foreign-born
- 11% · Canada, Vietnam, South Korea
- Languages at home
- 71% English-only · Spanish 23% Tagalog/Filipino 1% Other Asian/Pacific 1%
Political lean MEDSL · Bexar
- 2024 margin
- Lean D (+9.8) · D 54.3% · R 44.6% · Other 1.1%
- 2008→2024 swing
- +4.2pp toward D · 2008: 5.6pp · 2024: 9.8pp
- All cycles
- 2024: D+9.8 2020: D+18.2 2016: D+13.5 2012: D+4.6 2008: D+5.6
Not yet ingested
- Civics
- —
Market trends
- HPI YoY
- ▼ -51.02%
- Current HPI
- 236.4923
- Rent YoY
- ▼ -1.08%
- Metro
- San Antonio-New Braunfels, TX
- State GDP YoY
- ▲ 3.95%
- F500 in state
- 110
Industry mix (Fortune 500 HQ in TX)
| Industry | F500 HQs | Revenue |
|---|---|---|
| Energy | 16 | $1,198B |
|
||
| Technology | 5 | $198B |
|
||
| Engineering / Construction | 4 | $72B |
|
||
| Energy Services | 3 | $60B |
|
||
| Utilities | 3 | $41B |
|
||
| Healthcare | 2 | $330B |
|
||
Price history
+33.7% since first listed7 events — show timeline
- 2026-05-13 Price Changed $209,900 LERA
- 2026-04-18 Listed $218,900 LERA
- 2019-01-07 Sold (Public Records) — Public Records
- 2019-01-04 Sold (MLS) — LERA
- 2018-12-18 Pending — LERA
- 2018-12-07 Contingent — LERA
- 2018-11-24 Listed $157,000 LERA
Property tax history
+13.7%/yrLatest (2025): $4,847 · +2.4% YoY. Source: county tax records.
Cash-flow waterfall
monthlySold comps — $/sqft
last 12 mo · ≤1 miLoading sold comps…