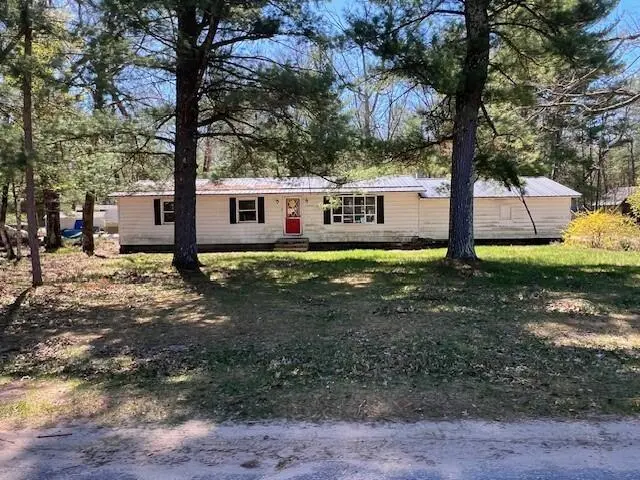
13553 S Star Lake Dr
Baldwin, MI 49304
$45,121F
3 bd · 1.0 ba ·
1,248 sqft ·
Built 1976
· SingleFamily
· Pending
· 27 DOM
Cashflow @ list (25.0% down · 7.5%)
Estimated rent
$1,156/mo
Mortgage (P&I)
−$1,636
Tax + insurance
−$195
HOA
−$0
Vac / Maint / Mgmt
−$243
Net cashflow
$-918/mo
Annual
$-11,010/yr
Cap rate
2.76%
Cash-on-cash
-12.60%
DSCR
0.44
1% rule
0.37%
Cash to close
$87,360
Investor read
- This is a 3-bed/1.0-bath single-family listed at $45k.
- At list price, monthly cash flow is $-918 ($-11k/yr) — negative.
- The deal already cash-flows at list — no discount required.
- Meets the 1% rule at list price ($1k rent vs $45k).
- It's been on market 27 days — a 2% lower offer ($44k) is reasonable based on typical stale-listing flexibility.
- Recommended offer: $44k (1.5% below list) — sets the bar for market timing.
- Local home prices are declining (-3.0%/yr); year-one equity from $2k of loan paydown is wiped out by about $9k of value loss. Plan a longer hold.
- Location reads 68/100 on livability (#360 in MI) — a middle-class / working-renter tenant base. Strengths: cost of living A+, health & safety A+, housing A; Watch: amenities F, commute F, employment F.
- Baldwin Community Schools (rural): math 21% / reading 28% proficiency, ranked #618 of 760 in MI (top 81%) — low school quality limits family demand, transient renter base, plan for 1-2y turnover; 85% free/reduced lunch — lower-income household profile, screen leases tightly.
- Zoned schools: Baldwin Elementary School (math 8% / reading 17%, grade F, #1,203 of 1,397 statewide, top 87%, 224 students, 97% FRL); Baldwin Junior High School (math 2% / reading 22%, grade F, #466 of 493 statewide, top 95%, 99 students, 98% FRL); Baldwin Senior High School (math 24% / reading 24%, grade F, #481 of 713 statewide, top 81%, 119 students, 96% FRL).
- Market conditions: 167 active listings in the ZIP; 30 units permitted in Lake County in 2024 (0 in 5+ unit buildings).
- Lake County population projected at -22% by 2050 — secular population decline; favor cash flow + early exit over multi-decade hold.
- 5 sale attempts since 21y ago with the ask held roughly flat each time — persistent listings suggest the price (not the market) is what's stuck; bring a comps-based counter.
- Cap rate 2.8% vs local median 3.6% in Baldwin — below-typical yield; the buyer is paying a premium for something (appreciation thesis, condition, location) that the cap rate doesn't capture.
Questions for listing agent
- What do current leases actually rent for vs. the listed asking? Can we see a recent rent roll and the last 12 months of T-12 income?
- Built in 1976 — when were the roof, HVAC, electrical panel, plumbing, and water heater last replaced?
- Is there a deadline driving the sale (1031 exchange, divorce, estate, relocation)? That informs how much negotiation room exists.
- Schools are F-rated, which usually means shorter tenancies and higher turnover. Who's the typical renter profile here, and what's been the actual vacancy rate?
- The area grade is low — what's the realistic commute time and amenity access for the typical tenant pool here? Any planned neighborhood developments (good or bad) we should know about?
- What's the average days-on-market for RENTAL listings here right now (not sales)? A rising rental-DOM trend means longer vacancies and softer asking-rent achievability than the comps imply.
- What's the recent tenant-quality profile in this submarket — average credit score on applications, eviction rate, late-payment / NSF rate, and stable-employment percentage? A property-management company in the area should have these aggregated.
- How much new for-sale + rental construction is in the pipeline within 1–3 miles? Heavy new supply typically softens prices + rents 12–24 months out; constrained supply supports both.
CashFlowRE · CFR-9S9R9NCWE17H5Y
· Data 3 weeks ago
cashflowre.app · 2026-05-29