 🔨 Auction
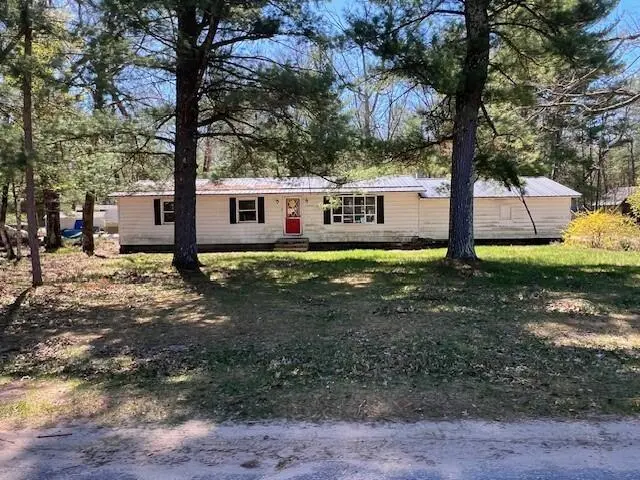
13553 S Star Lake Dr · Baldwin, MI
Flood risk 1/10 · Minimal
- FEMA flood zone
- —
- Chance of flooding over 30 yrs
- 0.0%
- Est. flood insurance / yr
- —
Fire risk 4/10 · Minor
- Est. fire insurance / yr
- $784 – $1,456
Heat risk 1/10 · Minimal
- Hot days now (above 96°F)
- 7 days/yr
- Hot days in 30 yrs
- 15 days/yr
Wind risk 1/10 · Minimal
- Chance of severe wind over 30 yrs
- —
Air-quality risk 2/10 · Minimal
- Unhealthy air days now
- 1 days/yr
- Unhealthy air days in 30 yrs
- 1 days/yr
Risk factors via First Street. Map © Google.
Why this score? — see what drove the F grade
The composite is a weighted blend of 9 inputs, each scored 0–100. Each bar is that input's sub-score; the figure is the points it added to the 100-point composite (weight × sub-score).
- ARV discount +7.5/15.0
- Cash flow +3.7/30.0
- Livability +3.4/5.0
- Rent growth +2.5/5.0
- Condition / age +2.5/5.0
- Schools +2.3/10.0
- 1% rule +0.0/10.0
- DSCR +0.0/10.0
- Appreciation +0.0/10.0
$45,121
🖨 Deal sheet (PDF) 📄 Offer letter ✓ Due diligence
Listing remarks MLS
Looking for a home away or a year-round home? Check out this ranch home in Lake Township. Close to Big Star Lake. Auction end date 7/15/25https://mynextbid.com/property/2367/13553-South-Star-Lake-Drive-Baldwin-MI-49304
Key facts
- Ranch home
- Big star lake
- 0.5 acre lot
Tags
Neighborhood map
What this means for you Summary
Snapshot
- This is a 3-bed/1.0-bath single-family listed at $45k.
Deal economics
- At list price, monthly cash flow is $-918 ($-11k/yr) — negative.
- The deal already cash-flows at list — no discount required.
- Meets the 1% rule at list price ($1k rent vs $45k).
- Recommended offer: $44k (1.5% below list) — sets the bar for market timing.
- Cap rate 2.8% vs local median 3.6% in Baldwin — below-typical yield; the buyer is paying a premium for something (appreciation thesis, condition, location) that the cap rate doesn't capture.
Location & tenants
- Location reads 68/100 on livability (#360 in MI) — a middle-class / working-renter tenant base. Strengths: cost of living A+, health & safety A+, housing A; Watch: amenities F, commute F, employment F.
- Baldwin Community Schools (rural): math 21% / reading 28% proficiency, ranked #618 of 760 in MI (top 81%) — low school quality limits family demand, transient renter base, plan for 1-2y turnover; 85% free/reduced lunch — lower-income household profile, screen leases tightly.
- Zoned schools: Baldwin Elementary School (math 8% / reading 17%, grade F, #1,203 of 1,397 statewide, top 87%, 224 students, 97% FRL); Baldwin Junior High School (math 2% / reading 22%, grade F, #466 of 493 statewide, top 95%, 99 students, 98% FRL); Baldwin Senior High School (math 24% / reading 24%, grade F, #481 of 713 statewide, top 81%, 119 students, 96% FRL).
- Market conditions: 167 active listings in the ZIP; 30 units permitted in Lake County in 2024 (0 in 5+ unit buildings).
Forward outlook
- Local home prices are declining (-3.0%/yr); year-one equity from $2k of loan paydown is wiped out by about $9k of value loss. Plan a longer hold.
- Lake County population projected at -22% by 2050 — secular population decline; favor cash flow + early exit over multi-decade hold.
Negotiation context
- It's been on market 27 days — a 2% lower offer ($44k) is reasonable based on typical stale-listing flexibility.
- 5 sale attempts since 21y ago with the ask held roughly flat each time — persistent listings suggest the price (not the market) is what's stuck; bring a comps-based counter.
Questions for the listing agent
- What do current leases actually rent for vs. the listed asking? Can we see a recent rent roll and the last 12 months of T-12 income?
- Built in 1976 — when were the roof, HVAC, electrical panel, plumbing, and water heater last replaced?
- Is there a deadline driving the sale (1031 exchange, divorce, estate, relocation)? That informs how much negotiation room exists.
- Schools are F-rated, which usually means shorter tenancies and higher turnover. Who's the typical renter profile here, and what's been the actual vacancy rate?
- The area grade is low — what's the realistic commute time and amenity access for the typical tenant pool here? Any planned neighborhood developments (good or bad) we should know about?
- What's the average days-on-market for RENTAL listings here right now (not sales)? A rising rental-DOM trend means longer vacancies and softer asking-rent achievability than the comps imply.
- What's the recent tenant-quality profile in this submarket — average credit score on applications, eviction rate, late-payment / NSF rate, and stable-employment percentage? A property-management company in the area should have these aggregated.
- How much new for-sale + rental construction is in the pipeline within 1–3 miles? Heavy new supply typically softens prices + rents 12–24 months out; constrained supply supports both.
Investment metrics
- 1% rule
- 0.37% ✗
- Cap rate
- 2.76%
- Cash-on-cash
- -12.60%
- DSCR
- 0.44
- GRM
- 22.5
CMA / ARV
- ARV (on-the-fly)
- $312,000
- Comps found
- 3
Show comp detail 3 sales within ~0.75 mi
| Address | Dist | Beds/Ba | Sqft | Sold | Price | $/sf | Match |
|---|---|---|---|---|---|---|---|
| 11672 S Red Cedar Ave | 0.18mi | 2/1.0 (-1) | 1,348 (+8%) | 16mo | $160,000 | $119 | 60 |
| 13788 S Star Lake Dr | 0.24mi | 2/1.5 (-1) | 1,400 (+12%) | 10mo | $349,500 | $250 | 54 |
| 14031 S Star Lake Dr | 0.43mi | 2/1.0 (-1) | 1,100 (-12%) | 10mo | $279,500 | $254 | 47 |
Match score weights: distance 35% · size 25% · config 20% · recency 20%. Top-matched comps best support the ARV.
Projected returns pro-forma
-3.0% appreciation · 3.0% rent growth · sell at horizon
- IRR
- -39.8%
- Equity multiple
- -0.25×
- Total profit
- $-109,178
- Equity at exit
- $46,520
- IRR
- -64.1%
- Equity multiple
- -0.96×
- Total profit
- $-171,061
- Equity at exit
- $26,976
Cash invested: $87,360 (down + closing). Projections, not guarantees.
Landlord ↔ Tenant lean methodology
- Overall (STATE)
- 62 Landlord-Friendly
- State Michigan
- 62 Landlord-Friendly · EVEN
- County
- — inherits STATE
- City
- — inherits STATE
ZIP-level market 49304
- Home prices YoY
- -30.4%
- Active inventory
- 167
- Price-to-rent
- 3.3×
Monthly cashflow live
- Estimated rent
- $1,156 medium interval (Pro) →
- Mortgage (P&I)
- −$1,636
- Tax from tax record
- −$65 /mo · $778/yr
- Insurance
- −$130
- HOA
- −$0
- Vacancy / Maint / Mgmt
- −$243
- Net cashflow
- $-918
Break-even live
Sensitivity live
| Price | -10% $-741 | -5% $-829 | +0% $-918 | +5% $-1,006 | +10% $-1,094 |
|---|---|---|---|---|---|
| Rent | -10% $-1,009 | -5% $-963 | +0% $-918 | +5% $-872 | +10% $-826 |
| Rate | -1.0pp $-760 | -0.5pp $-838 | base $-918 | +0.5pp $-998 | +1.0pp $-1,081 |
UW: 25.0% down · 7.5% · 30yr · 1.5% tax · 5.0% vac · 8.0% maint · 8.0% mgmt
Financing live
Cash to close
- Down payment
- $78,000
- Closing costs
- $9,360
- Reserves months
- —
- Total cash needed
- —
Loan-product check · same deal, 3 products live
Conventional
25% down · 7.5% · 30yr
- Down + closing
- —
- Monthly P&I
- —
- Monthly cashflow
- —
- DSCR
- —
- Eligible?
- —
Personal DTI + credit; lowest rate.
DSCR
20% down · 8.5% · 30yr
- Down + closing
- —
- Monthly P&I
- —
- Monthly cashflow
- —
- DSCR
- —
- Eligible?
- —
No personal income docs; deal must DSCR.
Hard money
10% down · 12.0% · 12mo
- Down + closing
- —
- Monthly P&I
- —
- Monthly cashflow
- —
- DSCR
- —
- Eligible?
- —
Short-term bridge; refi at stabilization.
Listing history 11 events
-
2025-07-28status Pending 218-char remark
Show marketing remark (219 chars)
Looking for a home away or a year-round home? Check out this ranch home in Lake Township. Close to Big Star Lake. Auction end date 7/15/25https://mynextbid.com/property/2367/13553-South-Star-Lake-Drive-Baldwin-MI-49304
-
2025-07-28status Pending 219-char remark
Show marketing remark (219 chars)
Looking for a home away or a year-round home? Check out this ranch home in Lake Township. Close to Big Star Lake. Auction end date 7/15/25https://mynextbid.com/property/2367/13553-South-Star-Lake-Drive-Baldwin-MI-49304
-
2025-07-28status Pending
Show marketing remark (219 chars)
Looking for a home away or a year-round home? Check out this ranch home in Lake Township. Close to Big Star Lake. Auction end date 7/15/25https://mynextbid.com/property/2367/13553-South-Star-Lake-Drive-Baldwin-MI-49304
-
2025-07-01$45,121 Active 219-char remark
Show marketing remark (218 chars)
Looking for a home away or a year-round home? Check out this ranch home in Lake Township. Close to Big Star Lake. Auction end date 7/15/25https://mynextbid.com/property/2367/13553-South-Star-Lake-Drive-Baldwin-MI-49304
-
2025-07-01$45,121 Active 218-char remark
Show marketing remark (218 chars)
Looking for a home away or a year-round home? Check out this ranch home in Lake Township. Close to Big Star Lake. Auction end date 7/15/25https://mynextbid.com/property/2367/13553-South-Star-Lake-Drive-Baldwin-MI-49304
-
2025-07-01$45,121 Active
Show marketing remark (218 chars)
Looking for a home away or a year-round home? Check out this ranch home in Lake Township. Close to Big Star Lake. Auction end date 7/15/25https://mynextbid.com/property/2367/13553-South-Star-Lake-Drive-Baldwin-MI-49304
-
2007-06-07soldstatus $60,000
-
2007-05-16soldstatus $60,000
-
2007-05-16soldstatus $60,000
-
2005-07-08$68,000
-
2005-07-08$68,000
ⓘ Source: listings_history table (triggers on properties + properties_extension) + one-shot
backfill from property_details.listing_events for pre-trigger history.
Tax reassessment forecast MI · Partial reset (capped growth)
- Current annual tax
- $778 · $65/mo
- Projected year-2 tax
- $778 · $65/mo
- Expected delta
- $0/yr ($0/mo · 0.0%)
ⓘ Screening estimate from a state-policy table — verify with the county assessor before closing.
Climate risk First Street
- Flood 1/10 Low 0% chance over 30 yrs
- Wildfire 4/10 Moderate
- Heat 1/10 Low 7 d/yr ≥96°F today · 15 d/yr by 30 yrs out
- Wind 1/10 Low
- Air quality 2/10 Low 1 unhealthy d/yr today · 1 by 30 yrs out
Nearby sold comps map
Loading sold comps map…
Walkable amenities ~0.75 mi
Loading nearby amenities…
Taxation est. · year 1
- Rental income
- $13,875
- − Mortgage interest
- −$17,477
- − Property taxes
- −$778
- − Insurance
- −$1,560
- − Repairs & maintenance
- −$1,110
- − Management
- −$1,110
- − Depreciation
- −$9,076
- Taxable loss
- −$17,236
- Est. tax savings @ 24.0%
- +$4,137
- After-tax cash flow
- $-6,874/yr
For passive investors: Depreciation is non-cash, so a rental often shows a tax loss while cash-flowing — sheltering income. Rental losses are passive: they offset passive income freely, and up to $25,000/yr can offset ordinary (W-2) income if you actively participate and your MAGI is under $100k (phasing out to $0 by $150k); unused losses carry forward. On sale, claimed depreciation is recaptured at up to 25%, and gains may owe capital-gains tax (a 1031 exchange can defer both). Figures are a year-1 estimate at your 24.0% rate — not tax advice; consult a CPA.
Schools (NCES district)
- District
- Baldwin Community Schools
- NCES district ID
- 2603810
- Math proficiency
- 21% ▲ 3.00%
- Reading proficiency
- 28% ▼ -2.00%
- Median HH income
- $27,638
- Composite
- 22.56/100
- National rank
- #13447
- State rank
- #618 of 760 in MI
Livability — Baldwin
- Score
- 68/100
- State rank
- #360
- US rank
- #9207
Category grades
Schools grade is shown separately in the Schools card above.
Census & demographics
- Population (ZIP)
- 4,680
Population outlook (Lake County) Hauer SSP2
- Today (2025)
- 10,933 people
- By 2030
- 10,503 · -3.9%
- By 2040
- 9,470 · -13.4%
- By 2050
- 8,526 · -22.0%
- By 2075
- 7,160 · -34.5%
- By 2100
- 5,634 · -48.5%
Race, ethnicity, and origin ACS 2023
- Neighborhood character
- Predominantly White (68%)
- Race & ethnicity
- White 68% Black 12% Hispanic / Latino 11% Two or more races 9% Native American 2%
- Hispanic origin (detail)
- Mexican 6% Puerto Rican 2%
- Common ancestry
- Romanian 5% Iranian 5% Lithuanian 3%
- Foreign-born
- 2% · Canada
- Languages at home
- 95% English-only · Spanish 4% Vietnamese 1%
Political lean MEDSL · Lake
- 2024 margin
- Solid R (+32.2) · D 33.2% · R 65.4% · Other 1.4%
- 2008→2024 swing
- -44.5pp toward R · 2008: 12.3pp · 2024: -32.2pp
- All cycles
- 2024: R+32.2 2020: R+26.2 2016: R+22.9 2012: D+5.0 2008: D+12.3
Not yet ingested
- Civics
- —
Market trends
- HPI YoY
- ▼ -51.01%
- Current HPI
- 116.6025
- Rent YoY
- —
- Metro
- —
- State GDP YoY
- ▲ 1.37%
- F500 in state
- 28
Industry mix (Fortune 500 HQ in MI)
| Industry | F500 HQs | Revenue |
|---|---|---|
| Automotive Parts | 3 | $48B |
|
||
| Automotive | 2 | $372B |
|
||
| Chemicals | 1 | $45B |
|
||
| Automotive Retail | 1 | $29B |
|
||
| Healthcare / Medical Devices | 1 | $23B |
|
||
| Automotive Technology | 1 | $20B |
|
||
Price history
-33.6% since first listed11 events — show timeline
- 2025-07-28 Pending — MiRealSource-MiMLS
- 2025-07-28 Pending — REALCOMP
- 2025-07-28 Pending — SW Michigan MLS
- 2025-07-01 Listed $45,121 REALCOMP
- 2025-07-01 Listed $45,121 SW Michigan MLS
- 2025-07-01 Listed $45,121 MiRealSource-MiMLS
- 2007-06-07 Sold (Public Records) $60,000 Public Records
- 2007-05-16 Sold (MLS) $60,000 REALCOMP
- 2007-05-16 Sold (MLS) $60,000 SW Michigan MLS
- 2005-07-08 Listed $68,000 REALCOMP
- 2005-07-08 Listed $68,000 SW Michigan MLS
Property tax history
-0.5%/yrLatest (2024): $778 · +5.2% YoY. Source: county tax records.
Cash-flow waterfall
monthlySold comps — $/sqft
last 12 mo · ≤1 miLoading sold comps…