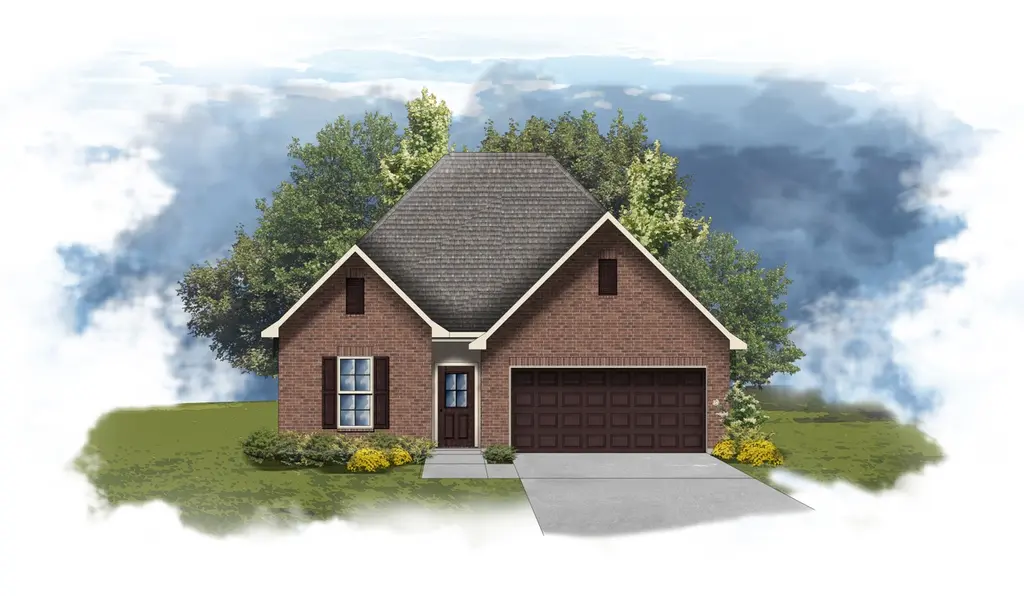
Falkner III A Plan
Bridge City, TX 77630
$274,990F
4 bd · 3.0 ba ·
2,092 sqft ·
Built —
· SingleFamily
· Active
· 861 DOM
Cashflow @ list (25.0% down · 7.5%)
Estimated rent
$1,626/mo
Mortgage (P&I)
−$1,822
Tax + insurance
−$579
HOA
−$0
Vac / Maint / Mgmt
−$341
Net cashflow
$-1,117/mo
Annual
$-13,401/yr
Cap rate
2.44%
Cash-on-cash
-13.77%
DSCR
0.39
1% rule
0.47%
Cash to close
$97,285
Investor read
- This is a 4-bed/3.0-bath single-family listed at $275k.
- At list price, monthly cash flow is $-1k ($-13k/yr) — negative.
- To cash-flow at today's rent, offer at most $186k (32.4% below list).
- To meet the 1% rule (rent ≥ 1% of price), the offer needs to be $163k (40.9% below list).
- It's been on market 861 days — a 12% lower offer ($242k) is reasonable based on typical stale-listing flexibility.
- Recommended offer: $163k (40.9% below list) — sets the bar for 1% rule.
- In year one you build about $6k of equity ($2k loan paydown + $4k appreciation (1.0% local appreciation)).
- Location reads 72/100 on livability (#251 in TX) — a middle-class / working-renter tenant base. Strengths: crime A+, employment A+, cost of living A+; Watch: schools C-, amenities F, commute F.
- Orangefield ISD (rural): math 44% / reading 48% proficiency, ranked #217 of 826 in TX (top 26%) — families likely to look elsewhere, expect single-tenant / working-renter base with shorter leases.
- Market conditions: Rents rising fast (+5.7%/yr); 337 active listings in the ZIP; 235 units permitted in Orange County in 2024 (50 in 5+ unit buildings).
- Orange County population projected at +6% by 2050 — modest demand growth; plan on rents tracking national, not racing it.
- By year 6, paydown + projected appreciation supports a ~$34k cash-out refi (75% LTV) — recoverable capital for the next deal without selling this one.
- Climate carrying-cost: moderate flood risk; severe wind risk, 99% chance of damaging wind over 30y; extreme-heat days projected 7→23/yr by 2055 (HVAC capex compounding) — expect insurance premiums to compound above CPI over the hold.
- This rent runs 30% of the median local income ($64k/yr) — at the standard rent-burdened threshold; future hikes will face affordability resistance.
Questions for listing agent
- What do current leases actually rent for vs. the listed asking? Can we see a recent rent roll and the last 12 months of T-12 income?
- It's been on market 861 days. Have you received any prior offers? Is the seller open to a 41% concession, seller financing, or rate buy-down credit?
- Why hasn't it sold? Are there any deal-killer items the seller is aware of (foundation, flood, title, zoning, code violations)?
- Is there a deadline driving the sale (1031 exchange, divorce, estate, relocation)? That informs how much negotiation room exists.
- The area grade is low — what's the realistic commute time and amenity access for the typical tenant pool here? Any planned neighborhood developments (good or bad) we should know about?
- What's the average days-on-market for RENTAL listings here right now (not sales)? A rising rental-DOM trend means longer vacancies and softer asking-rent achievability than the comps imply.
- What's the recent tenant-quality profile in this submarket — average credit score on applications, eviction rate, late-payment / NSF rate, and stable-employment percentage? A property-management company in the area should have these aggregated.
- How much new for-sale + rental construction is in the pipeline within 1–3 miles? Heavy new supply typically softens prices + rents 12–24 months out; constrained supply supports both.
CashFlowRE · CFR-9TN1YDBJ4RYBZ1
· Data 2 days ago
cashflowre.app · 2026-05-29