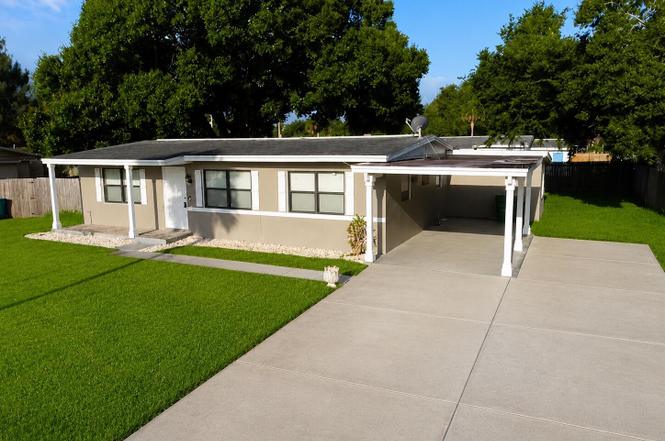
1165 King St
Tropical Park, FL 32953
$278,900F
3 bd · 2.0 ba ·
1,050 sqft ·
Built 1965
· SingleFamily
· Active
· 127 DOM
Cashflow @ list (25.0% down · 7.5%)
Estimated rent
$1,822/mo
Mortgage (P&I)
−$1,463
Tax + insurance
−$408
HOA
−$0
Vac / Maint / Mgmt
−$383
Net cashflow
$-431/mo
Annual
$-5,177/yr
Cap rate
4.72%
Cash-on-cash
-5.61%
DSCR
0.75
1% rule
0.65%
Cash to close
$78,092
Investor read
- This is a 3-bed/2.0-bath single-family listed at $279k.
- At list price, monthly cash flow is $-431 ($-5k/yr) — negative.
- To cash-flow at today's rent, offer at most $203k (27.3% below list).
- To meet the 1% rule (rent ≥ 1% of price), the offer needs to be $182k (34.7% below list).
- It's been on market 127 days — a 12% lower offer ($245k) is reasonable based on typical stale-listing flexibility.
- Recommended offer: $182k (34.7% below list) — sets the bar for 1% rule.
- Local home prices are declining (-3.0%/yr); year-one equity from $2k of loan paydown is wiped out by about $8k of value loss. Plan a longer hold.
- Location reads: area grade F — affects rentability + tenant quality, not the cash-flow math above.
- Brevard (suburban): math 53% / reading 57% proficiency, ranked #19 of 73 in FL (top 26%) — acceptable for families but not a draw, mixed tenant base, ~2y average lease.
- Zoned schools: Audubon Elementary School (math 55% / reading 57%, grade C+, #832 of 2,144 statewide, top 40%, 450 students, 58% FRL); Thomas Jefferson Middle School (math 63% / reading 55%, grade B, #144 of 571 statewide, top 26%, 608 students, 43% FRL); Merritt Island High School (math 32% / reading 55%, grade F, #248 of 667 statewide, top 38%, 1,546 students, 35% FRL) — zoned schools at 45% FRL track the district average.
- Watch-outs: flood insurance adds $66/mo.
- Market conditions: Rents rising (+2.1%/yr); 219 active listings in the ZIP; 16 comparable units currently listed for rent nearby; rentals at typical pace (median 24d on market — plan ~3-4 weeks tenant-placement turnaround); solid renter incomes; 4,602 units permitted in Brevard County in 2024 (702 in 5+ unit buildings).
- Brevard County population projected at +15% by 2050 — modest demand growth; plan on rents tracking national, not racing it.
- 3 sale attempts since 11y ago with the ask held roughly flat each time — persistent listings suggest the price (not the market) is what's stuck; bring a comps-based counter.
- Current owner paid $115k; list at $279k implies a 143% gain — meaningful room to come down on a strong offer.
- Climate carrying-cost: severe flood risk; severe wind risk, 99% chance of damaging wind over 30y; extreme-heat days projected 7→23/yr by 2055 (HVAC capex compounding) — expect insurance premiums to compound above CPI over the hold.
Questions for listing agent
- What do current leases actually rent for vs. the listed asking? Can we see a recent rent roll and the last 12 months of T-12 income?
- It's been on market 127 days. Have you received any prior offers? Is the seller open to a 35% concession, seller financing, or rate buy-down credit?
- Built in 1965 — when were the roof, HVAC, electrical panel, plumbing, and water heater last replaced?
- What's the actual annual flood-insurance premium (NFIP or private), and is the property in a SFHA with mandatory coverage?
- Why hasn't it sold? Are there any deal-killer items the seller is aware of (foundation, flood, title, zoning, code violations)?
- Is there a deadline driving the sale (1031 exchange, divorce, estate, relocation)? That informs how much negotiation room exists.
- The area grade is low — what's the realistic commute time and amenity access for the typical tenant pool here? Any planned neighborhood developments (good or bad) we should know about?
- What's the average days-on-market for RENTAL listings here right now (not sales)? A rising rental-DOM trend means longer vacancies and softer asking-rent achievability than the comps imply.
CashFlowRE · CFR-9TVGEC4649Z1FG
· Data 2 days ago
cashflowre.app · 2026-05-29