1165 King St · Tropical Park, FL
Flood risk 8/10 · Major
- FEMA flood zone
- X (unshaded)
- Chance of flooding over 30 yrs
- 0.95%
- Est. flood insurance / yr
- $507 – $1,088
Fire risk 2/10 · Minimal
- Est. fire insurance / yr
- $947 – $1,759
Heat risk 10/10 · Severe
- Hot days now (above 106°F)
- 7 days/yr
- Hot days in 30 yrs
- 23 days/yr
Wind risk 10/10 · Severe
- Chance of severe wind over 30 yrs
- 99.0%
Air-quality risk 1/10 · Minimal
- Unhealthy air days now
- 0 days/yr
- Unhealthy air days in 30 yrs
- 0 days/yr
Risk factors via First Street. Map © Google.
Why this score? — see what drove the F grade
The composite is a weighted blend of 9 inputs, each scored 0–100. Each bar is that input's sub-score; the figure is the points it added to the 100-point composite (weight × sub-score).
- ARV discount +7.5/15.0
- Cash flow +7.4/30.0
- Schools +4.7/10.0
- Rent growth +3.0/5.0
- Livability +2.5/5.0
- Condition / age +2.5/5.0
- 1% rule +1.5/10.0
- DSCR +1.5/10.0
- Appreciation +0.0/10.0
$278,900
🖨 Deal sheet 📄 Offer letter ✓ Due diligence
Listing remarks MLS
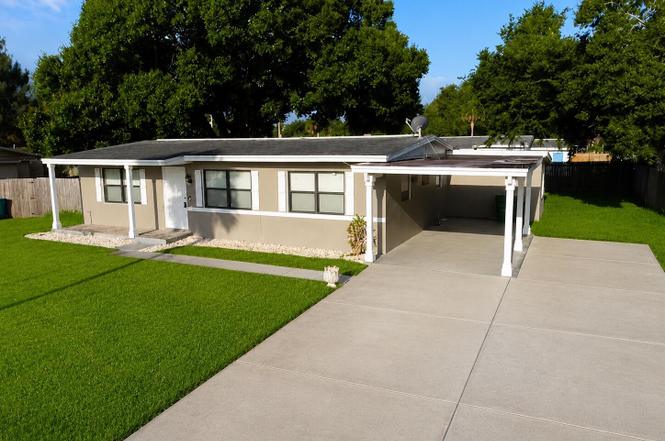
Newly renovated home has NEW 42''real wood Kitchen Cabinets and Granite Countertops. NEW Carpeting in the bedrooms. NEW Roof. NEW Plumbing and Light Fixtures. Also New are the Baseboards and Tile Floors. 4th bedroom has an attached sitting room with French doors leading to the living area. Extra parking for an R. V. and a large backyard with room for expansion.
Key facts
- Hardwood flooring
- Versatile den
- Ceiling fans
Tags
Property features AI
Exterior
- Parking: Attached carport (1 space)
- Utilities: Public sewer; Cable available; Electricity available
- Home design: Single family residence; One story; Faces east
- Construction: Concrete construction; Shingle roof
- Exterior features: Wood fencing
Interior
- Kitchen: Dishwasher; Electric range; Microwave; Refrigerator
- Bedrooms: 4 bedrooms
- Flooring: Carpet; Wood
- Bathrooms: 2 full bathrooms
- Heating & cooling: Central heating; Central air
- Interior features: Ceiling fan(s)
- Laundry & utility: Washer hookup; Electric dryer hookup
Neighborhood map
What this means for you Summary
Snapshot
- This is a 3-bed/2.0-bath single-family listed at $279k.
Deal economics
- At list price, monthly cash flow is $-431 ($-5k/yr) — negative.
- To cash-flow at today's rent, offer at most $203k (27.3% below list).
- To meet the 1% rule (rent ≥ 1% of price), the offer needs to be $182k (34.7% below list).
- Recommended offer: $182k (34.7% below list) — sets the bar for 1% rule.
Location & tenants
- Location reads: area grade F — affects rentability + tenant quality, not the cash-flow math above.
- Brevard (suburban): math 53% / reading 57% proficiency, ranked #19 of 73 in FL (top 26%) — acceptable for families but not a draw, mixed tenant base, ~2y average lease.
- Zoned schools: Audubon Elementary School (math 55% / reading 57%, grade C+, #832 of 2,144 statewide, top 40%, 450 students, 58% FRL); Thomas Jefferson Middle School (math 63% / reading 55%, grade B, #144 of 571 statewide, top 26%, 608 students, 43% FRL); Merritt Island High School (math 32% / reading 55%, grade F, #248 of 667 statewide, top 38%, 1,546 students, 35% FRL) — zoned schools at 45% FRL track the district average.
- Market conditions: Rents rising (+2.1%/yr); 219 active listings in the ZIP; 16 comparable units currently listed for rent nearby; rentals at typical pace (median 23d on market — plan ~3-4 weeks tenant-placement turnaround); solid renter incomes; 4,602 units permitted in Brevard County in 2024 (702 in 5+ unit buildings).
Forward outlook
- Local home prices are declining (-3.0%/yr); year-one equity from $2k of loan paydown is wiped out by about $8k of value loss. Plan a longer hold.
- Brevard County population projected at +15% by 2050 — modest demand growth; plan on rents tracking national, not racing it.
Negotiation context
- It's been on market 127 days — a 12% lower offer ($245k) is reasonable based on typical stale-listing flexibility.
- 3 sale attempts since 11y ago with the ask held roughly flat each time — persistent listings suggest the price (not the market) is what's stuck; bring a comps-based counter.
- Current owner paid $115k; list at $279k implies a 143% gain — meaningful room to come down on a strong offer.
Risks & watch-outs
- Watch-outs: flood insurance adds $66/mo.
- Climate carrying-cost: severe flood risk; severe wind risk, 99% chance of damaging wind over 30y; extreme-heat days projected 7→23/yr by 2055 (HVAC capex compounding) — expect insurance premiums to compound above CPI over the hold.
Questions for the listing agent
- What do current leases actually rent for vs. the listed asking? Can we see a recent rent roll and the last 12 months of T-12 income?
- It's been on market 127 days. Have you received any prior offers? Is the seller open to a 35% concession, seller financing, or rate buy-down credit?
- Built in 1965 — when were the roof, HVAC, electrical panel, plumbing, and water heater last replaced?
- What's the actual annual flood-insurance premium (NFIP or private), and is the property in a SFHA with mandatory coverage?
- Why hasn't it sold? Are there any deal-killer items the seller is aware of (foundation, flood, title, zoning, code violations)?
- Is there a deadline driving the sale (1031 exchange, divorce, estate, relocation)? That informs how much negotiation room exists.
- The area grade is low — what's the realistic commute time and amenity access for the typical tenant pool here? Any planned neighborhood developments (good or bad) we should know about?
- What's the average days-on-market for RENTAL listings here right now (not sales)? A rising rental-DOM trend means longer vacancies and softer asking-rent achievability than the comps imply.
- What's the recent tenant-quality profile in this submarket — average credit score on applications, eviction rate, late-payment / NSF rate, and stable-employment percentage? A property-management company in the area should have these aggregated.
- How much new for-sale + rental construction is in the pipeline within 1–3 miles? Heavy new supply typically softens prices + rents 12–24 months out; constrained supply supports both.
Investment metrics
- 1% rule
- 0.65% ✗
- Cap rate
- 4.72%
- Cash-on-cash
- -5.61%
- DSCR
- 0.75
- GRM
- 12.8
CMA / ARV
No comps found within radius.
Projected returns pro-forma
-3.0% appreciation · 2.12% rent growth · sell at horizon
- IRR
- -28.7%
- Equity multiple
- 0.05×
- Total profit
- $-74,277
- Equity at exit
- $41,585
- IRR
- -32.1%
- Equity multiple
- -0.36×
- Total profit
- $-106,536
- Equity at exit
- $24,114
Cash invested: $78,092 (down + closing). Projections, not guarantees.
Landlord ↔ Tenant lean methodology
- Overall (STATE)
- 87 Strongly Landlord-Friendly
- State Florida
- 87 Strongly Landlord-Friendly · R+3
- County
- — inherits STATE
- City
- — inherits STATE
ZIP-level market 32953
- Home prices YoY
- -34.5%
- Rents YoY
- 2.1%
- Active inventory
- 219
- Price-to-rent
- 12.8×
Monthly cashflow live
- Estimated rent
- $1,822 high interval (Pro) →
- Mortgage (P&I)
- −$1,463
- Tax from tax record
- −$226 /mo · $2,708/yr
- Insurance
- −$116
- Flood insurance flood zone
- −$66 /mo · $798/yr
- HOA
- −$0
- Vacancy / Maint / Mgmt
- −$383
- Net cashflow
- $-431
Break-even live
UW: 25.0% down · 7.5% · 30yr · 1.5% tax · 5.0% vac · 8.0% maint · 8.0% mgmt
Financing live
Cash to close
- Down payment
- $69,725
- Closing costs
- $8,367
- Reserves months
- —
- Total cash needed
- —
Loan-product check · same deal, 3 products live
Conventional
25% down · 7.5% · 30yr
- Down + closing
- —
- Monthly P&I
- —
- Monthly cashflow
- —
- DSCR
- —
- Eligible?
- —
Personal DTI + credit; lowest rate.
DSCR
20% down · 8.5% · 30yr
- Down + closing
- —
- Monthly P&I
- —
- Monthly cashflow
- —
- DSCR
- —
- Eligible?
- —
No personal income docs; deal must DSCR.
Hard money
10% down · 12.0% · 12mo
- Down + closing
- —
- Monthly P&I
- —
- Monthly cashflow
- —
- DSCR
- —
- Eligible?
- —
Short-term bridge; refi at stabilization.
Rent comps 16 comps
| Address | Beds | Baths | Sqft | Rent | $/sqft | DOM | Units | Dist |
|---|---|---|---|---|---|---|---|---|
| 225 Ligustrum Ln Merritt Island, FL | 1.0–2.0 | 1.0 | 640 | $1,275 | $1.99 | 19d | 1 | 0.18mi |
| 1155 N Courtenay Pkwy Merritt Island, FL | 2.0 | 1.0 | 750 | $1,434 | $1.91 | 23d | 1 | 0.21mi |
| 360 Schoolhouse Ln Merritt Island, FL | 3.0 | 2.0 | 953 | $1,500 | $1.57 | 23d | 1 | 0.63mi |
| 140 Minna Ln Merritt Island, FL | 2.0 | 1.0 | 775 | $1,250 | $1.61 | 14d | 1 | 0.74mi |
| 10 Bogart Pl Merritt Island, FL | 3.0 | 2.5 | 1376 | $2,350 | $1.71 | 23d | 1 | 0.75mi |
| 43 Bogart Pl Merritt Island, FL | 2.0 | 1.5 | 1172 | $1,875 | $1.60 | 23d | 1 | 0.77mi |
| 48 Bogart Pl Merritt Island, FL | 2.0 | 1.5 | 1184 | $1,800 | $1.52 | 23d | 1 | 0.80mi |
| 1525 Polaris St Merritt Island, FL | 3.0 | 2.0 | 1462 | $2,400 | $1.64 | 14d | 1 | 0.81mi |
| 50 Needle Blvd #28 Merritt Island, FL | 2.0 | 1.5 | 900 | $1,550 | $1.72 | 23d | 1 | 0.92mi |
| 215 Richland Ave Unit 1044313P Merritt Island, FL | 3.0 | 2.0 | 1184 | $4,648 | $3.93 | 14d | 1 | 0.93mi |
| 55 Needle Blvd Merritt Island, FL | 2.0 | 1.5 | 900 | $1,545 | $1.72 | 14d | 2 | 0.96mi |
| 55 Needle Blvd Merritt Island, FL | 2.0 | 1.5 | 900 | $1,525 | $1.69 | 23d | 2 | 0.96mi |
| 145 Needle Blvd Merritt Island, FL | 4.0 | 2.0 | 1314 | $3,250 | $2.47 | 23d | 1 | 1.04mi |
| 388 Hibiscus Ave Merritt Island, FL | 2.0 | 1.0 | 720 | $1,650 | $2.29 | 23d | 1 | 1.15mi |
| 140 McLeod St Unit 1513829P Merritt Island, FL | 3.0 | 2.0 | 1323 | $3,291 | $2.49 | 19d | 1 | 1.33mi |
| 205 Palmetto Ave Merritt Island, FL | 2.0 | 2.0 | 1033 | $1,625 | $1.57 | 23d | 2 | 1.43mi |
Listing history 26 events
-
2026-06-18days on market $278,900 Active 127 DOM
-
2026-06-17days on market $278,900 Active 126 DOM
-
2026-06-16days on market $278,900 Active 125 DOM
-
2026-06-15days on market $278,900 Active 124 DOM
-
2026-06-14days on market $278,900 Active 122 DOM
-
2026-06-10days on market $278,900 Active 119 DOM
-
2026-06-08days on market $278,900 Active 117 DOM
-
2026-06-07days on market $278,900 Active 116 DOM
-
2026-06-05days on market $278,900 Active 113 DOM
-
2026-06-03days on market $278,900 Active 112 DOM
-
2026-06-02days on market $278,900 Active 111 DOM
-
2026-06-01days on market $278,900 Active 110 DOM
-
2026-05-31days on market $278,900 Active 109 DOM
-
2026-05-31days on market $278,900 Active 108 DOM
-
2026-05-23status Pending
-
2026-05-21price $278,900
-
2026-04-30price $279,900
-
2026-04-16price $280,000
-
2026-02-13price $285,000
-
2026-02-05$289,000 Active
-
2016-05-02soldstatus $115,000
-
2016-04-29soldstatus $115,000 363-char remark
Show marketing remark (363 chars)
Newly renovated home has NEW 42''real wood Kitchen Cabinets and Granite Countertops. NEW Carpeting in the bedrooms. NEW Roof. NEW Plumbing and Light Fixtures. Also New are the Baseboards and Tile Floors. 4th bedroom has an attached sitting room with French doors leading to the living area. Extra parking for an R. V. and a large backyard with room for expansion.
-
2015-10-31$115,000 363-char remark
Show marketing remark (363 chars)
Newly renovated home has NEW 42''real wood Kitchen Cabinets and Granite Countertops. NEW Carpeting in the bedrooms. NEW Roof. NEW Plumbing and Light Fixtures. Also New are the Baseboards and Tile Floors. 4th bedroom has an attached sitting room with French doors leading to the living area. Extra parking for an R. V. and a large backyard with room for expansion.
-
2015-07-13soldstatus $45,100 536-char remark
Show marketing remark (536 chars)
Handyman Special three bedroom home has an open floor plan, large kitchen with eating space, tile and laminate flooring and the master has a private bath. Situated on a large lot with lovely Oak trees. All Information recorded in the MLS is intended to be accurate but cannot be guaranteed, buyer advised to verify. Sold As-Is. No utilities will be turned on to this property and only cash offers with 0 day inspection period will be considered. Buyer should perform their due diligence/necessary inspections before submitting an offer.
-
2015-06-18$39,900 536-char remark
Show marketing remark (536 chars)
Handyman Special three bedroom home has an open floor plan, large kitchen with eating space, tile and laminate flooring and the master has a private bath. Situated on a large lot with lovely Oak trees. All Information recorded in the MLS is intended to be accurate but cannot be guaranteed, buyer advised to verify. Sold As-Is. No utilities will be turned on to this property and only cash offers with 0 day inspection period will be considered. Buyer should perform their due diligence/necessary inspections before submitting an offer.
-
2000-10-25soldstatus $53,000
ⓘ Source: listings_history table (triggers on properties + properties_extension) + one-shot
backfill from property_details.listing_events for pre-trigger history.
Tax reassessment forecast FL · Resets to sale price
- Current annual tax
- $2,708 · $226/mo
- Projected year-2 tax
- $2,708 · $226/mo
- Expected delta
- $0/yr ($0/mo · -0.0%)
ⓘ Screening estimate from a state-policy table — verify with the county assessor before closing.
Climate risk First Street
- Flood 8/10 Severe FEMA zone X (unshaded) · 95% chance over 30 yrs
- Wildfire 2/10 Low
- Heat 10/10 Extreme 7 d/yr ≥106°F today · 23 d/yr by 30 yrs out
- Wind 10/10 Extreme 99% chance of damaging wind over 30 yrs
- Air quality 1/10 Low 0 unhealthy d/yr today · 0 by 30 yrs out
Nearby sold comps map
Loading sold comps map…
Walkable amenities ~0.75 mi
Loading nearby amenities…
Taxation est. · year 1
- Rental income
- $21,865
- − Mortgage interest
- −$15,623
- − Property taxes
- −$2,708
- − Insurance
- −$2,192
- − Repairs & maintenance
- −$1,749
- − Management
- −$1,749
- − Depreciation
- −$8,113
- Taxable loss
- −$10,269
- Est. tax savings @ 24.0%
- +$2,464
- After-tax cash flow
- $-2,712/yr
For passive investors: Depreciation is non-cash, so a rental often shows a tax loss while cash-flowing — sheltering income. Rental losses are passive: they offset passive income freely, and up to $25,000/yr can offset ordinary (W-2) income if you actively participate and your MAGI is under $100k (phasing out to $0 by $150k); unused losses carry forward. On sale, claimed depreciation is recaptured at up to 25%, and gains may owe capital-gains tax (a 1031 exchange can defer both). Figures are a year-1 estimate at your 24.0% rate — not tax advice; consult a CPA.
Schools (NCES district)
- District
- Brevard
- NCES district ID
- 1200150
- Math proficiency
- 53% ▼ -9.00%
- Reading proficiency
- 57% ▼ -4.00%
- Median HH income
- $49,426
- Composite
- 46.86/100
- National rank
- #2370
- State rank
- #19 of 73 in FL
Livability — Tropical Park
No livability data for this city. (Only ~50 U.S. cities are tracked.)
Census & demographics
- Census place
- Tropical Park, FL
- County
- Brevard County · 602,871 people
- City population
- 24,834
- Metro
- Palm Bay-Melbourne-Titusville, FL
- Population (ZIP)
- 24,759
- Household income
- $87,262
- Rent vs Own
- Severe rent burden
- 849.0
Population outlook (Brevard County) Hauer SSP2
- Today (2025)
- 623,254 people
- By 2030
- 648,420 · +4.0%
- By 2040
- 690,009 · +10.7%
- By 2050
- 715,669 · +14.8%
- By 2075
- 775,744 · +24.5%
- By 2100
- 776,687 · +24.6%
Race, ethnicity, and origin ACS 2023
- Neighborhood character
- Predominantly White (77%)
- Race & ethnicity
- White 77% Hispanic / Latino 13% Two or more races 7% Black 4% Asian 3%
- Hispanic origin (detail)
- Mexican 2% Puerto Rican 6%
- Common ancestry
- Slovak 3% Romanian 3% Lithuanian 3%
- Foreign-born
- 9% · Canada, China, Jamaica
- Languages at home
- 87% English-only · Spanish 8% Tagalog/Filipino 2% French/Haitian/Cajun 1%
Political lean MEDSL · Brevard
- 2024 margin
- Strong R (+20.8) · D 39.1% · R 59.9% · Other 1.0%
- 2008→2024 swing
- -10.4pp toward R · 2008: -10.4pp · 2024: -20.8pp
- All cycles
- 2024: R+20.8 2020: R+16.4 2016: R+19.8 2012: R+12.7 2008: R+10.4
Not yet ingested
- Civics
- —
Market trends
- HPI YoY
- ▼ -168.76%
- Current HPI
- 320.1966
- Rent YoY
- ▲ 2.12%
- Metro
- Palm Bay-Melbourne-Titusville, FL
- State GDP YoY
- ▲ 3.28%
- F500 in state
- 36
Industry mix (Fortune 500 HQ in FL)
| Industry | F500 HQs | Revenue |
|---|---|---|
| Industrial Technology | 2 | $29B |
|
||
| Insurance | 2 | $17B |
|
||
| Retail | 1 | $60B |
|
||
| Technology Distribution | 1 | $58B |
|
||
| Homebuilding | 1 | $35B |
|
||
| Technology Manufacturing | 1 | $35B |
|
||
Price history
+426.2% since first listed12 events — show timeline
- 2026-05-23 Pending — SCMLS
- 2026-05-21 Price Changed $278,900 SCMLS
- 2026-04-30 Price Changed $279,900 SCMLS
- 2026-04-16 Price Changed $280,000 SCMLS
- 2026-02-13 Price Changed $285,000 SCMLS
- 2026-02-05 Listed $289,000 SCMLS
- 2016-05-02 Sold (Public Records) $115,000 Public Records
- 2016-04-29 Sold (MLS) $115,000 SCMLS
- 2015-10-31 Listed $115,000 SCMLS
- 2015-07-13 Sold (MLS) $45,100 SCMLS
- 2015-06-18 Listed $39,900 SCMLS
- 2000-10-25 Sold (Public Records) $53,000 Public Records
Property tax history
+11.0%/yrLatest (2025): $2,708 · +0.2% YoY. Source: county tax records.
Cash-flow waterfall
monthlySold comps — $/sqft
last 12 mo · ≤1 miLoading sold comps…