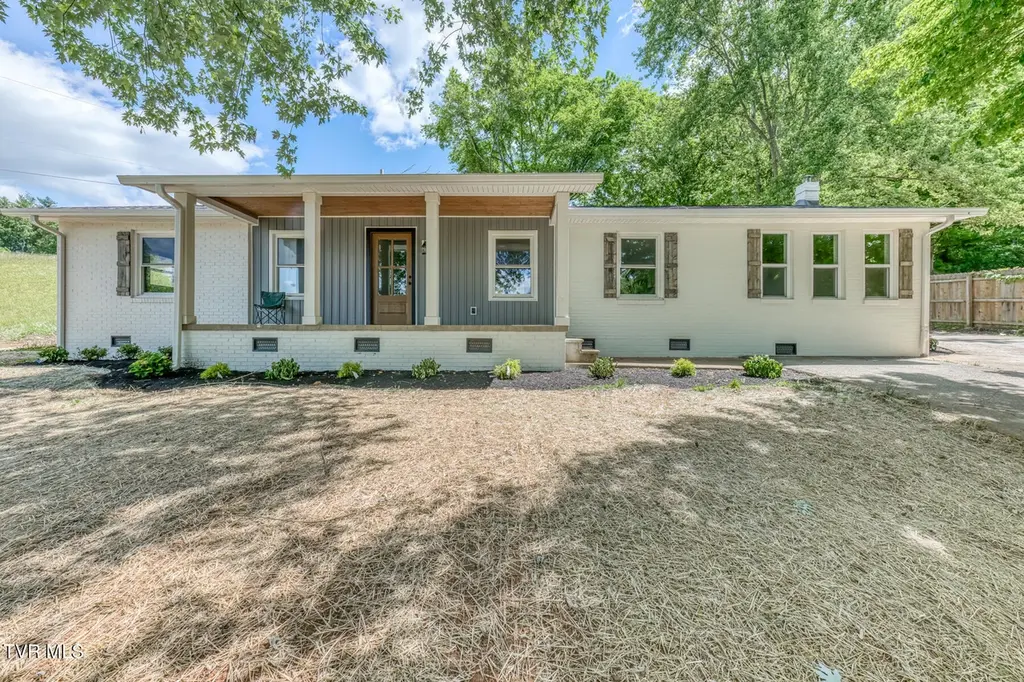
545 J A Hodge Rd
Johnson City, TN 37686
$495,000C+
3 bd · 2.0 ba ·
1,674 sqft ·
Built 1970
· SingleFamily
· Active
· 31 DOM
Cashflow @ list (25.0% down · 7.5%)
Estimated rent
$8,246/mo
Mortgage (P&I)
−$2,596
Tax + insurance
−$825
HOA
−$0
Vac / Maint / Mgmt
−$1,732
Net cashflow
$3,094/mo
Annual
$37,122/yr
Cap rate
13.79%
Cash-on-cash
26.78%
DSCR
2.19
1% rule
1.67%
Cash to close
$138,600
Investor read
- This is a 3-bed/2.0-bath single-family listed at $495k.
- At list price, monthly cash flow is $3k ($37k/yr) — positive.
- The deal already cash-flows at list — no discount required.
- Meets the 1% rule at list price ($8k rent vs $495k).
- It's been on market 31 days — a 3% lower offer ($480k) is reasonable based on typical stale-listing flexibility.
- Recommended offer: $480k (3.0% below list) — sets the bar for market timing.
- Local home prices are declining (-3.0%/yr); year-one equity from $3k of loan paydown is wiped out by about $15k of value loss. Plan a longer hold.
- Location reads 76/100 on livability (#8 in TN, #3,349 nationally) — a middle-class / working-renter tenant base. Strengths: amenities A+, cost of living A+, health & safety A; Watch: crime D, commute F, employment F.
- Sullivan County (suburban): math 17% / reading 24% proficiency, ranked #109 of 139 in TN (top 78%) — low school quality limits family demand, transient renter base, plan for 1-2y turnover.
- Zoned schools: Mary Hughes School (math 27% / reading 22%, grade F, #546 of 952 statewide, top 61%, 339 students, 0% FRL); Sullivan East Middle School (math 8% / reading 11%, grade F, #260 of 333 statewide, top 79%, 573 students, 0% FRL); Sullivan East High School (math 10% / reading 27%, grade F, #208 of 332 statewide, top 63%, 849 students, 0% FRL) — zoned schools average 0% FRL vs 45% district-wide (45 pts lower); this property's tenant base skews higher-income than the district average.
- Market conditions: 85 active listings in the ZIP; 1 comparable units currently listed for rent nearby; 453 units permitted in Sullivan County in 2024 (6 in 5+ unit buildings).
- Sullivan County population projected to shrink 5% by 2050 — rents likely to lag national; underwrite the cash flow, not the appreciation.
- Current owner paid $104k; list at $495k implies a 374% gain — meaningful room to come down on a strong offer.
- At projected returns (-3.0% appreciation + 3.0% rent growth), your $139k cash investment doubles in ~5 years — after that, you're playing with house money.
- Climate carrying-cost: moderate wildfire risk — expect insurance premiums to compound above CPI over the hold.
- Cap rate 13.8% vs local median 3.1% in Johnson City — top-decile yield for the area; either an underpriced asset or a hidden risk that comps aren't pricing in. Stress-test before assuming the spread holds.
Questions for listing agent
- It's been on market 31 days. Have you received any prior offers? Is the seller open to a 3% concession, seller financing, or rate buy-down credit?
- Built in 1970 — when were the roof, HVAC, electrical panel, plumbing, and water heater last replaced?
- Is there a deadline driving the sale (1031 exchange, divorce, estate, relocation)? That informs how much negotiation room exists.
- Crime grade is D in this area — have there been break-ins, vandalism, or insurance claims at this property in the last 3 years? What carrier currently insures it and at what premium?
- What's the average days-on-market for RENTAL listings here right now (not sales)? A rising rental-DOM trend means longer vacancies and softer asking-rent achievability than the comps imply.
- What's the recent tenant-quality profile in this submarket — average credit score on applications, eviction rate, late-payment / NSF rate, and stable-employment percentage? A property-management company in the area should have these aggregated.
- How much new for-sale + rental construction is in the pipeline within 1–3 miles? Heavy new supply typically softens prices + rents 12–24 months out; constrained supply supports both.
CashFlowRE · CFR-9VBS1KBW57NHYW
· Data 1 day ago
cashflowre.app · 2026-05-29