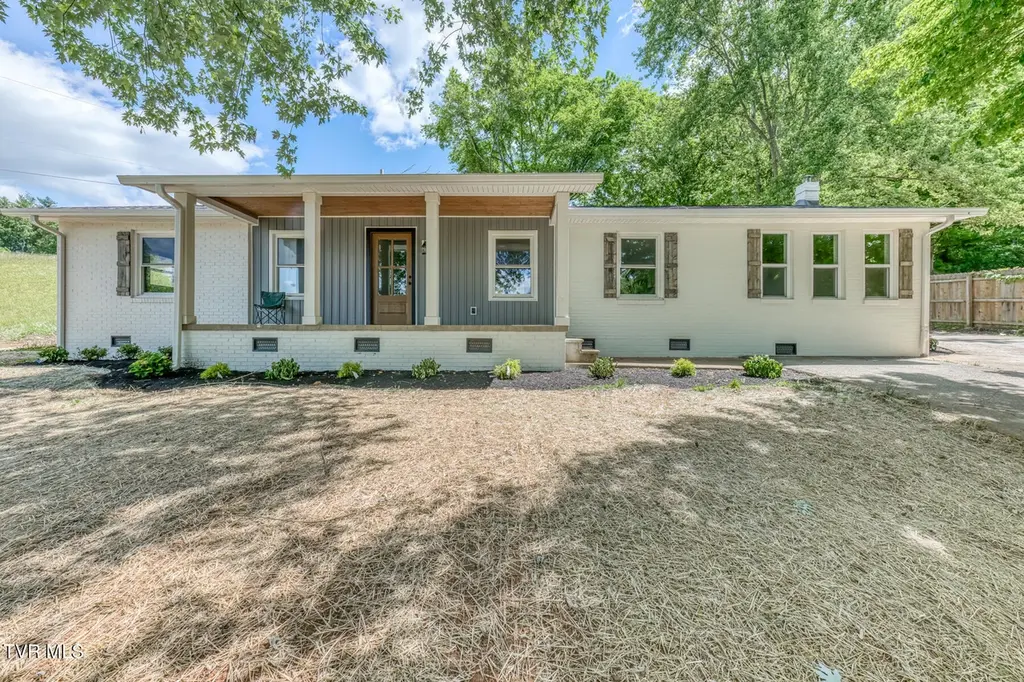
545 J A Hodge Rd · Johnson City, TN
Flood risk 1/10 · Minimal
- FEMA flood zone
- X (unshaded)
- Chance of flooding over 30 yrs
- 0.0%
- Est. flood insurance / yr
- $507 – $1,088
Fire risk 5/10 · Moderate
- Est. fire insurance / yr
- $949 – $1,763
Heat risk 4/10 · Minor
- Hot days now (above 99°F)
- 7 days/yr
- Hot days in 30 yrs
- 21 days/yr
Wind risk 2/10 · Minimal
- Chance of severe wind over 30 yrs
- —
Air-quality risk 2/10 · Minimal
- Unhealthy air days now
- 1 days/yr
- Unhealthy air days in 30 yrs
- 2 days/yr
Risk factors via First Street. Map © Google.
Why this score? — see what drove the C+ grade
The composite is a weighted blend of 9 inputs, each scored 0–100. Each bar is that input's sub-score; the figure is the points it added to the 100-point composite (weight × sub-score).
- Cash flow +30.0/30.0
- 1% rule +10.0/10.0
- DSCR +10.0/10.0
- Livability +3.8/5.0
- Rent growth +2.5/5.0
- Condition / age +2.5/5.0
- Schools +1.8/10.0
- ARV discount +0.0/15.0
- Appreciation +0.0/10.0
$495,000
🖨 Deal sheet 📄 Offer letter ✓ Due diligence
Listing remarks
Set on approximately half an acre in Piney Flats, this beautifully reimagined home offers more than just updated finishes, it offers a lifestyle centered around comfort, simplicity, and enjoying where you live. Start your mornings with coffee on the front porch overlooking views of Boone Lake, where changing seasons and peaceful surroundings create a setting that feels just a little slower and more connected. Inside, nearly every inch of the home has been thoughtfully renovated, creating the feel of a brand-new space while maintaining the character of an established home. From the sheetrock and true hardwood flooring to the kitchen, bathrooms, windows, doors, roof, fixtures, and finishes, t
Key facts
- Updated finishes
- Natural light
- Refreshed bathrooms
Tags
Property features AI
Finance
- Other: Residential zoning
- Financial info:
- HOA & community:
Exterior
- Parking: Driveway with asphalt, concrete and gravel surfaces
- Security: Smoke detector(s)
- Utilities: Public water; Septic tank
- Home design: Single family house; One level; Updated/remodeled
- Construction: Brick construction; Shingle roof
- Exterior features: Front porch; Has a view; Cleared lot with steep slope
Interior
- Kitchen: Kitchen island
- Bedrooms: Total rooms: 8
- Flooring: Ceramic tile; Hardwood
- Bathrooms: 3 full bathrooms
- Heating & cooling: Central air; Heat pump; Electric heating
- Interior features: Kitchen island; Walk-in closets; Double pane windows
- Laundry & utility:
Neighborhood map
What this means for you Summary
Snapshot
- This is a 3-bed/2.0-bath single-family listed at $495k.
Deal economics
- At list price, monthly cash flow is $3k ($37k/yr) — positive.
- The deal already cash-flows at list — no discount required.
- Meets the 1% rule at list price ($8k rent vs $495k).
- Recommended offer: $480k (3.0% below list) — sets the bar for market timing.
- Cap rate 13.8% vs local median 3.1% in Johnson City — top-decile yield for the area; either an underpriced asset or a hidden risk that comps aren't pricing in. Stress-test before assuming the spread holds.
Location & tenants
- Location reads 76/100 on livability (#8 in TN, #3,349 nationally) — a middle-class / working-renter tenant base. Strengths: amenities A+, cost of living A+, health & safety A; Watch: crime D, commute F, employment F.
- Sullivan County (suburban): math 17% / reading 24% proficiency, ranked #109 of 139 in TN (top 78%) — low school quality limits family demand, transient renter base, plan for 1-2y turnover.
- Zoned schools: Mary Hughes School (math 27% / reading 22%, grade F, #546 of 952 statewide, top 61%, 339 students, 0% FRL); Sullivan East Middle School (math 8% / reading 11%, grade F, #260 of 333 statewide, top 79%, 573 students, 0% FRL); Sullivan East High School (math 10% / reading 27%, grade F, #208 of 332 statewide, top 63%, 849 students, 0% FRL) — zoned schools average 0% FRL vs 45% district-wide (45 pts lower); this property's tenant base skews higher-income than the district average.
- Market conditions: 85 active listings in the ZIP; 1 comparable units currently listed for rent nearby; 453 units permitted in Sullivan County in 2024 (6 in 5+ unit buildings).
Forward outlook
- Local home prices are declining (-3.0%/yr); year-one equity from $3k of loan paydown is wiped out by about $15k of value loss. Plan a longer hold.
- Sullivan County population projected to shrink 5% by 2050 — rents likely to lag national; underwrite the cash flow, not the appreciation.
- At projected returns (-3.0% appreciation + 3.0% rent growth), your $139k cash investment doubles in ~5 years — after that, you're playing with house money.
Negotiation context
- It's been on market 31 days — a 3% lower offer ($480k) is reasonable based on typical stale-listing flexibility.
- Current owner paid $104k; list at $495k implies a 374% gain — meaningful room to come down on a strong offer.
Risks & watch-outs
- Climate carrying-cost: moderate wildfire risk — expect insurance premiums to compound above CPI over the hold.
Questions for the listing agent
- It's been on market 31 days. Have you received any prior offers? Is the seller open to a 3% concession, seller financing, or rate buy-down credit?
- Built in 1970 — when were the roof, HVAC, electrical panel, plumbing, and water heater last replaced?
- Is there a deadline driving the sale (1031 exchange, divorce, estate, relocation)? That informs how much negotiation room exists.
- Crime grade is D in this area — have there been break-ins, vandalism, or insurance claims at this property in the last 3 years? What carrier currently insures it and at what premium?
- What's the average days-on-market for RENTAL listings here right now (not sales)? A rising rental-DOM trend means longer vacancies and softer asking-rent achievability than the comps imply.
- What's the recent tenant-quality profile in this submarket — average credit score on applications, eviction rate, late-payment / NSF rate, and stable-employment percentage? A property-management company in the area should have these aggregated.
- How much new for-sale + rental construction is in the pipeline within 1–3 miles? Heavy new supply typically softens prices + rents 12–24 months out; constrained supply supports both.
Investment metrics
- 1% rule
- 1.67% ✓
- Cap rate
- 13.79%
- Cash-on-cash
- 26.78%
- DSCR
- 2.19
- GRM
- 5.0
CMA / ARV
- ARV (on-the-fly)
- $349,866
- Comps found
- 12
Show comp detail 12 sales within ~0.75 mi
| Address | Dist | Beds/Ba | Sqft | Sold | Price | $/sf | Match |
|---|---|---|---|---|---|---|---|
| 1202 Raccoon Ln | 0.42mi | 3/2.0 | 1,689 (+1%) | 11mo | $330,000 | $195 | 70 |
| 447 Bayhill Dr | 0.34mi | 3/2.0 | 1,568 (-6%) | 6mo | $262,000 | $167 | 68 |
| 5130 Wildlife Cir | 0.42mi | 4/2.0 (+1) | 1,756 (+5%) | 1mo | $362,000 | $206 | 67 |
| 1496 Raccoon Ln | 0.50mi | 3/2.0 | 1,618 (-3%) | 10mo | $350,000 | $216 | 62 |
| 5659 Wildlife Cir | 0.42mi | 4/2.0 (+1) | 1,774 (+6%) | 4mo | $370,000 | $209 | 62 |
| 521 Baywood Dr | 0.48mi | 3/2.5 | 1,615 (-4%) | 11mo | $389,429 | $241 | 61 |
| 1335 Raccoon Ln | 0.48mi | 3/2.0 | 1,623 (-3%) | 16mo | $357,000 | $220 | 60 |
| 1545 Raccoon Ln | 0.55mi | 4/2.0 (+1) | 1,764 (+5%) | 8mo | $360,000 | $204 | 54 |
| 5031 Wildlife Cir | 0.50mi | 4/2.0 (+1) | 1,764 (+5%) | 12mo | $372,000 | $211 | 53 |
| 5034 Wildlife Cir | 0.49mi | 4/2.0 (+1) | 1,768 (+6%) | 13mo | $359,000 | $203 | 52 |
| 2310 Egret Ln | 0.50mi | 4/2.0 (+1) | 1,851 (+11%) | 12mo | $360,000 | $194 | 44 |
| 129 Redman Ln | 0.50mi | 4/2.5 (+1) | 1,905 (+14%) | 4mo | $616,000 | $323 | 43 |
Match score weights: distance 35% · size 25% · config 20% · recency 20%. Top-matched comps best support the ARV.
Projected returns pro-forma
-3.0% appreciation · 3.0% rent growth · sell at horizon
- IRR
- 20.7%
- Equity multiple
- 1.84×
- Total profit
- $116,940
- Equity at exit
- $73,806
- IRR
- 28.9%
- Equity multiple
- 3.57×
- Total profit
- $356,039
- Equity at exit
- $42,799
Cash invested: $138,600 (down + closing). Projections, not guarantees.
Landlord ↔ Tenant lean methodology
- Overall (STATE)
- 87 Strongly Landlord-Friendly
- State Tennessee
- 87 Strongly Landlord-Friendly · R+13
- County
- — inherits STATE
- City
- — inherits STATE
ZIP-level market 37686
- Home prices YoY
- -10.2%
- Active inventory
- 85
- Price-to-rent
- 5.0×
Monthly cashflow live
- Estimated rent
- $8,246 medium interval (Pro) →
- Mortgage (P&I)
- −$2,596
- Tax est. 1.5%
- −$619 /mo · $7,425/yr
- Insurance
- −$206
- HOA
- −$0
- Vacancy / Maint / Mgmt
- −$1,732
- Net cashflow
- $3,094
Break-even live
UW: 25.0% down · 7.5% · 30yr · 1.5% tax · 5.0% vac · 8.0% maint · 8.0% mgmt
Financing live
Cash to close
- Down payment
- $123,750
- Closing costs
- $14,850
- Reserves months
- —
- Total cash needed
- —
Loan-product check · same deal, 3 products live
Conventional
25% down · 7.5% · 30yr
- Down + closing
- —
- Monthly P&I
- —
- Monthly cashflow
- —
- DSCR
- —
- Eligible?
- —
Personal DTI + credit; lowest rate.
DSCR
20% down · 8.5% · 30yr
- Down + closing
- —
- Monthly P&I
- —
- Monthly cashflow
- —
- DSCR
- —
- Eligible?
- —
No personal income docs; deal must DSCR.
Hard money
10% down · 12.0% · 12mo
- Down + closing
- —
- Monthly P&I
- —
- Monthly cashflow
- —
- DSCR
- —
- Eligible?
- —
Short-term bridge; refi at stabilization.
Rent comps 1 comps
| Address | Beds | Baths | Sqft | Rent | $/sqft | DOM | Units | Dist |
|---|---|---|---|---|---|---|---|---|
| 521 Baywood Dr Unit 1397963P Piney Flats, TN | 2.0 | 2.5 | 1614 | $8,246 | $5.11 | 21d | 1 | 0.50mi |
Listing history 19 events
-
2026-06-19days on market $495,000 Active 31 DOM
-
2026-06-18days on market $495,000 Active 30 DOM
-
2026-06-17days on market $495,000 Active 29 DOM
-
2026-06-16days on market $495,000 Active 28 DOM
-
2026-06-15days on market $495,000 Active 27 DOM
-
2026-06-14days on market $495,000 Active 25 DOM
-
2026-06-13days on market $495,000 Active 24 DOM
-
2026-06-10days on market $495,000 Active 22 DOM
-
2026-06-09days on market $495,000 Active 21 DOM
-
2026-06-08days on market $495,000 Active 20 DOM
-
2026-06-07days on market $495,000 Active 19 DOM
-
2026-06-02days on market $495,000 Active 14 DOM
-
2026-06-01days on market $495,000 Active 13 DOM
-
2026-05-31days on market $495,000 Active 12 DOM
-
2026-05-30days on market $495,000 Active 11 DOM
-
2026-05-19$495,000 Active
-
2005-08-15soldstatus $104,500
-
2005-01-06soldstatus $70,000
-
1993-05-13soldstatus $55,000
ⓘ Source: listings_history table (triggers on properties + properties_extension) + one-shot
backfill from property_details.listing_events for pre-trigger history.
Climate risk First Street
- Flood 1/10 Low FEMA zone X (unshaded) · 0% chance over 30 yrs
- Wildfire 5/10 Major
- Heat 4/10 Moderate 7 d/yr ≥99°F today · 21 d/yr by 30 yrs out
- Wind 2/10 Low
- Air quality 2/10 Low 1 unhealthy d/yr today · 2 by 30 yrs out
Nearby sold comps map
Loading sold comps map…
Walkable amenities ~0.75 mi
Loading nearby amenities…
Taxation est. · year 1
- Rental income
- $98,952
- − Mortgage interest
- −$27,728
- − Property taxes
- −$7,425
- − Insurance
- −$2,475
- − Repairs & maintenance
- −$7,916
- − Management
- −$7,916
- − Depreciation
- −$14,400
- Taxable income
- $31,092
- Est. tax owed @ 24.0%
- −$7,462
- After-tax cash flow
- $29,660/yr
For passive investors: Depreciation is non-cash, so a rental often shows a tax loss while cash-flowing — sheltering income. Rental losses are passive: they offset passive income freely, and up to $25,000/yr can offset ordinary (W-2) income if you actively participate and your MAGI is under $100k (phasing out to $0 by $150k); unused losses carry forward. On sale, claimed depreciation is recaptured at up to 25%, and gains may owe capital-gains tax (a 1031 exchange can defer both). Figures are a year-1 estimate at your 24.0% rate — not tax advice; consult a CPA.
Schools (NCES district)
- District
- Sullivan County
- NCES district ID
- 4703990
- Math proficiency
- 17% ▼ -15.00%
- Reading proficiency
- 24% ▼ -10.00%
- Median HH income
- $43,263
- Composite
- 17.66/100
- National rank
- #9030
- State rank
- #109 of 139 in TN
Livability — Johnson City
- Score
- 76/100
- State rank
- #8
- US rank
- #3349
Category grades
Schools grade is shown separately in the Schools card above.
Census & demographics
- City population
- 99,926
- Population (ZIP)
- 9,149
Population outlook (Sullivan County) Hauer SSP2
- Today (2025)
- 157,030 people
- By 2030
- 156,415 · -0.4%
- By 2040
- 153,778 · -2.1%
- By 2050
- 149,018 · -5.1%
- By 2075
- 138,068 · -12.1%
- By 2100
- 119,927 · -23.6%
Race, ethnicity, and origin ACS 2023
- Neighborhood character
- Predominantly White (92%)
- Race & ethnicity
- White 92% Asian 3% Hispanic / Latino 2% Two or more races 2% Black 1%
- Common ancestry
- Iranian 7% Slovak 3% Serbian 3%
- Foreign-born
- 1%
- Languages at home
- 99% English-only · Spanish 1%
Political lean MEDSL · Sullivan
- 2024 margin
- Solid R (+55.0) · D 22.0% · R 77.0% · Other 1.0%
- 2008→2024 swing
- -13.6pp toward R · 2008: -41.3pp · 2024: -55.0pp
- All cycles
- 2024: R+55.0 2020: R+51.9 2016: R+56.2 2012: R+47.2 2008: R+41.3
Not yet ingested
- Civics
- —
Market trends
- HPI YoY
- ▼ -34.96%
- Current HPI
- 306.7377
- Rent YoY
- —
- Metro
- —
- State GDP YoY
- ▲ 2.78%
- F500 in state
- 22
Industry mix (Fortune 500 HQ in TN)
| Industry | F500 HQs | Revenue |
|---|---|---|
| Healthcare | 3 | $91B |
|
||
| Retail | 3 | $72B |
|
||
| Transportation / Logistics | 1 | $88B |
|
||
| Paper / Packaging | 1 | $19B |
|
||
| Insurance | 1 | $13B |
|
||
| Energy | 1 | $12B |
|
||
Price history
+800.0% since first listed4 events — show timeline
- 2026-05-19 Listed $495,000 TVRMLS
- 2005-08-15 Sold (Public Records) $104,500 Public Records
- 2005-01-06 Sold (Public Records) $70,000 Public Records
- 1993-05-13 Sold (Public Records) $55,000 Public Records
Property tax history
+4.2%/yrLatest (2025): $970 · +24.7% YoY. Source: county tax records.
Cash-flow waterfall
monthlySold comps — $/sqft
last 12 mo · ≤1 miLoading sold comps…