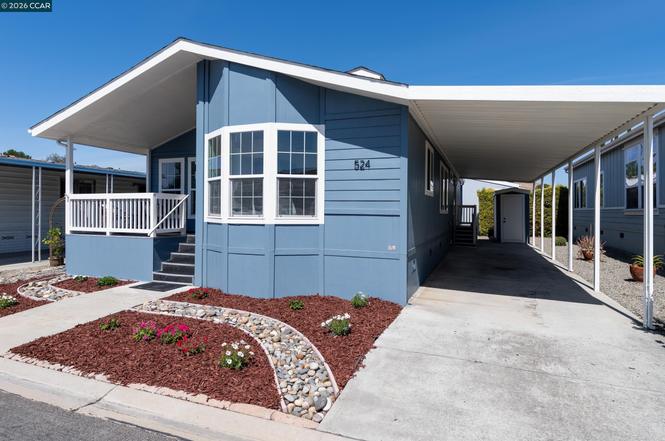
524 Mill Pond Dr #524
San Jose, CA 95125
$388,888F
3 bd · 2.0 ba ·
1,332 sqft ·
Built 2006
· Manufactured
· Active
· 12 DOM
Cashflow @ list (25.0% down · 7.5%)
Estimated rent
$3,106/mo
Mortgage (P&I)
−$2,039
Tax + insurance
−$800
HOA
−$0
Vac / Maint / Mgmt
−$652
Net cashflow
$-386/mo
Annual
$-4,627/yr
Cap rate
5.57%
Cash-on-cash
-2.57%
DSCR
0.89
1% rule
0.80%
Cash to close
$108,889
Investor read
- This is a 3-bed/2.0-bath manufactured listed at $389k.
- At list price, monthly cash flow is $-386 ($-5k/yr) — negative.
- To cash-flow at today's rent, offer at most $333k (14.3% below list).
- To meet the 1% rule (rent ≥ 1% of price), the offer needs to be $311k (20.1% below list).
- Only 12 days on market — expect competitive offers; lowballing is unlikely to land.
- Recommended offer: $311k (20.1% below list) — sets the bar for 1% rule.
- Local home prices are declining (-3.0%/yr); year-one equity from $3k of loan paydown is wiped out by about $12k of value loss. Plan a longer hold.
- Location reads 78/100 on livability (#68 in CA, #2,559 nationally) — a middle-class / working-renter tenant base. Strengths: amenities A+, commute A+, employment A+; Watch: crime F, cost of living F.
- East Side Union High (urban): math 53% / reading 70% proficiency, ranked #69 of 517 in CA (top 13%) — acceptable for families but not a draw, mixed tenant base, ~2y average lease.
- Zoned schools: Shirakawa (George Sr.) Elementary (633 students, 49% FRL); Bridges Academy (287 students, 72% FRL); Evergreen Valley High (math 76% / reading 83%, grade A-, #45 of 1,170 statewide, top 4%, 2,767 students, 13% FRL).
- Zoned-school proficiency averages 80% at this address vs 62% district-wide (+18 pts) — the actual schools serving this property are materially stronger than the East Side Union High average implies; a family-tenant draw the district grade alone would hide.
- Watch-outs: flood insurance adds $152/mo.
- Market conditions: Rents rising (+4.0%/yr); 120 active listings in the ZIP; 28 comparable units currently listed for rent nearby; rentals leasing fast (median 6d on market — plan ~1-2 weeks tenant-placement turnaround); high-income renter base; 3,838 units permitted in Santa Clara County in 2024 (1,886 in 5+ unit buildings).
- Santa Clara County population projected at +24% by 2050 — long-run rental-demand tailwind backs the buy-and-hold thesis.
- 6 sale attempts since 16y ago with the ask held roughly flat each time — persistent listings suggest the price (not the market) is what's stuck; bring a comps-based counter.
- Current owner paid $230k; list at $389k implies a 69% gain — meaningful room to come down on a strong offer.
- Climate carrying-cost: in FEMA flood zone AH (mandatory federal flood insurance); extreme-heat days projected 7→14/yr by 2055 (HVAC capex compounding) — expect insurance premiums to compound above CPI over the hold.
- Cap rate 5.6% vs local median 1.6% in San Jose — top-decile yield for the area; either an underpriced asset or a hidden risk that comps aren't pricing in. Stress-test before assuming the spread holds.
Questions for listing agent
- What do current leases actually rent for vs. the listed asking? Can we see a recent rent roll and the last 12 months of T-12 income?
- What's the actual annual flood-insurance premium (NFIP or private), and is the property in a SFHA with mandatory coverage?
- Is there a deadline driving the sale (1031 exchange, divorce, estate, relocation)? That informs how much negotiation room exists.
- Crime grade is F in this area — have there been break-ins, vandalism, or insurance claims at this property in the last 3 years? What carrier currently insures it and at what premium?
- The area grade is low — what's the realistic commute time and amenity access for the typical tenant pool here? Any planned neighborhood developments (good or bad) we should know about?
- What's the average days-on-market for RENTAL listings here right now (not sales)? A rising rental-DOM trend means longer vacancies and softer asking-rent achievability than the comps imply.
- What's the recent tenant-quality profile in this submarket — average credit score on applications, eviction rate, late-payment / NSF rate, and stable-employment percentage? A property-management company in the area should have these aggregated.
- How much new for-sale + rental construction is in the pipeline within 1–3 miles? Heavy new supply typically softens prices + rents 12–24 months out; constrained supply supports both.
CashFlowRE · CFR-9WAJX6CC9KRGBE
· Data 1 h ago
cashflowre.app · 2026-05-29