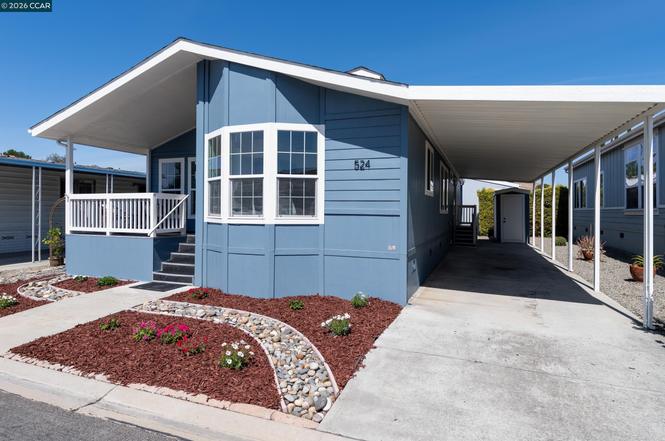
524 Mill Pond Dr #524 · San Jose, CA
Flood risk 4/10 · Minor
- FEMA flood zone
- AH
- Chance of flooding over 30 yrs
- 0.24%
- Est. flood insurance / yr
- $1,142 – $2,507
Fire risk 1/10 · Minimal
- Est. fire insurance / yr
- $659 – $1,223
Heat risk 5/10 · Moderate
- Hot days now (above 94°F)
- 7 days/yr
- Hot days in 30 yrs
- 14 days/yr
Wind risk 1/10 · Minimal
- Chance of severe wind over 30 yrs
- —
Air-quality risk 9/10 · Severe
- Unhealthy air days now
- 17 days/yr
- Unhealthy air days in 30 yrs
- 17 days/yr
Risk factors via First Street. Map © Google.
Why this score? — see what drove the D+ grade
The composite is a weighted blend of 9 inputs, each scored 0–100. Each bar is that input's sub-score; the figure is the points it added to the 100-point composite (weight × sub-score).
- Cash flow +20.3/30.0
- DSCR +6.4/10.0
- Schools +5.5/10.0
- 1% rule +5.4/10.0
- Livability +3.9/5.0
- Rent growth +3.5/5.0
- Condition / age +2.5/5.0
- ARV discount +0.0/15.0
- Appreciation +0.0/10.0
$388,888
🖨 Deal sheet (PDF) 📄 Offer letter ✓ Due diligence
Listing remarks MLS
This enchanting home is perfect for anyone looking to live in a Five Star Senior park! Gourmet kitchen features tons of cabinents, counter space, breakfast bar and nook. High rise toilets, ceiling fans, newer washer and dryer, carpets and interior paint make this a special doll house. Outside a cozy front porch, lovely landscaping with drip system , 2 car carport and spacious shed will delight you too. .take a look and get ready to move. .2006 Silvercrest, 2/2,1332sf, 17312145A/B
Key facts
- Quartz countertops
- Extensive cabinetry
- Updated kitchen
Tags
Property features AI
Finance
- HOA & community: Pets allowed with limits and upon approval; Senior community; Community clubhouse; Community pool; Tennis courts; BBQ area; Game room; Recreation facilities; Greenbelt; Electric metered; Gas metered
Exterior
- Parking: 2-car garage spaces; Carport; Guest parking; 2 covered parking spaces
- Utilities: Public water; Public sewer; Individual electric meter; Individual gas meter
- Home design: Manufactured in park (mobile home); Double wide model (WESTWOOD)
- Construction: Vinyl siding
- Exterior features: Front porch; Porch steps; Patio; Awning(s); Front yard; Back yard; Side yard; Shed(s); Landscaped
Interior
- Kitchen: Stone countertops; Gas range / cooktop; Free-standing range; Microwave; Refrigerator; Updated kitchen with breakfast nook
- Bedrooms: 3 bedrooms (street level)
- Flooring: Vinyl flooring
- Bathrooms: 2 full bathrooms; Primary bathroom with stall shower, tub and stone finishes
- Heating & cooling: Forced air heating; Fireplace heating; Central air conditioning; Ceiling fans
- Interior features: Breakfast nook; Updated kitchen; Sun porch; Living room; Mirrored closet doors; Electric fireplace
- Laundry & utility: Laundry room with washer and dryer; 220V outlet; Cabinets in laundry area
Neighborhood map
What this means for you Summary
Snapshot
- This is a 3-bed/2.0-bath manufactured listed at $389k.
Deal economics
- At list price, monthly cash flow is $347 ($4k/yr) — positive.
- The deal already cash-flows at list — no discount required.
- Meets the 1% rule at list price ($4k rent vs $389k).
- Cap rate 7.8% vs local median 1.6% in San Jose — top-decile yield for the area; either an underpriced asset or a hidden risk that comps aren't pricing in. Stress-test before assuming the spread holds.
Location & tenants
- Location reads 78/100 on livability (#68 in CA, #2,559 nationally) — a middle-class / working-renter tenant base. Strengths: amenities A+, commute A+, employment A+; Watch: crime F, cost of living F.
- East Side Union High (urban): math 53% / reading 70% proficiency, ranked #69 of 517 in CA (top 13%) — acceptable for families but not a draw, mixed tenant base, ~2y average lease.
- Zoned schools: Shirakawa (George Sr.) Elementary (633 students, 49% FRL); Bridges Academy (287 students, 72% FRL); Evergreen Valley High (math 76% / reading 83%, grade A-, #45 of 1,170 statewide, top 4%, 2,767 students, 13% FRL).
- Zoned-school proficiency averages 80% at this address vs 62% district-wide (+18 pts) — the actual schools serving this property are materially stronger than the East Side Union High average implies; a family-tenant draw the district grade alone would hide.
- Market conditions: Rents rising (+4.0%/yr); 119 active listings in the ZIP; 28 comparable units currently listed for rent nearby; rentals leasing fast (median 6d on market — plan ~1-2 weeks tenant-placement turnaround); high-income renter base; 3,838 units permitted in Santa Clara County in 2024 (1,886 in 5+ unit buildings).
- This rent runs 30% of the median local income ($161k/yr) — at the standard rent-burdened threshold; future hikes will face affordability resistance.
Forward outlook
- Local home prices are declining (-3.0%/yr); year-one equity from $3k of loan paydown is wiped out by about $12k of value loss. Plan a longer hold.
- Santa Clara County population projected at +24% by 2050 — long-run rental-demand tailwind backs the buy-and-hold thesis.
Negotiation context
- Only 11 days on market — expect competitive offers; lowballing is unlikely to land.
- 6 sale attempts since 16y ago with the ask held roughly flat each time — persistent listings suggest the price (not the market) is what's stuck; bring a comps-based counter.
- Current owner paid $230k; list at $389k implies a 69% gain — meaningful room to come down on a strong offer.
Risks & watch-outs
- Watch-outs: flood insurance adds $152/mo.
- Climate carrying-cost: in FEMA flood zone AH (mandatory federal flood insurance); extreme-heat days projected 7→14/yr by 2055 (HVAC capex compounding) — expect insurance premiums to compound above CPI over the hold.
Questions for the listing agent
- What's the actual annual flood-insurance premium (NFIP or private), and is the property in a SFHA with mandatory coverage?
- Is there a deadline driving the sale (1031 exchange, divorce, estate, relocation)? That informs how much negotiation room exists.
- Crime grade is F in this area — have there been break-ins, vandalism, or insurance claims at this property in the last 3 years? What carrier currently insures it and at what premium?
- The area grade is low — what's the realistic commute time and amenity access for the typical tenant pool here? Any planned neighborhood developments (good or bad) we should know about?
- What's the average days-on-market for RENTAL listings here right now (not sales)? A rising rental-DOM trend means longer vacancies and softer asking-rent achievability than the comps imply.
- What's the recent tenant-quality profile in this submarket — average credit score on applications, eviction rate, late-payment / NSF rate, and stable-employment percentage? A property-management company in the area should have these aggregated.
- How much new for-sale + rental construction is in the pipeline within 1–3 miles? Heavy new supply typically softens prices + rents 12–24 months out; constrained supply supports both.
Investment metrics
- 1% rule
- 1.04% ✓
- Cap rate
- 7.83%
- Cash-on-cash
- 5.50%
- DSCR
- 1.24
- GRM
- 8.0
CMA / ARV
- ARV (on-the-fly)
- $263,736
- Comps found
- 12
Show comp detail 12 sales within ~0.75 mi
| Address | Dist | Beds/Ba | Sqft | Sold | Price | $/sf | Match |
|---|---|---|---|---|---|---|---|
| 499 Millpond Dr #499 | 0.02mi | 3/2.0 | 1,440 (+8%) | 0mo | $380,000 | $264 | 85 |
| 380 Millpond Dr #380 | 0.09mi | 2/2.0 (-1) | 1,296 (-3%) | 9mo | $275,000 | $212 | 79 |
| 485 Millpond Dr #485 | 0.04mi | 2/2.0 (-1) | 1,440 (+8%) | 2mo | $339,000 | $235 | 78 |
| 484 Millpond #484 | 0.04mi | 2/2.0 (-1) | 1,400 (+5%) | 13mo | $277,000 | $198 | 74 |
| 556 Millpond Dr #556 | 0.14mi | 3/2.0 | 1,488 (+12%) | 1mo | $279,900 | $188 | 73 |
| 750 Millstream Dr #750 | 0.29mi | 2/2.0 (-1) | 1,344 (+1%) | 13mo | $350,000 | $260 | 69 |
| 337 Mill Pond Dr #337 | 0.25mi | 2/2.0 (-1) | 1,440 (+8%) | 1mo | $220,000 | $153 | 69 |
| 548 Mill Pond Dr #548 | 0.09mi | 2/2.0 (-1) | 1,440 (+8%) | 11mo | $280,000 | $194 | 68 |
| 375 S Millpond Dr #375 | 0.13mi | 2/2.0 (-1) | 1,512 (+14%) | 4mo | $280,000 | $185 | 64 |
| 451 Millpond Dr #451 | 0.10mi | 2/2.0 (-1) | 1,488 (+12%) | 9mo | $280,000 | $188 | 63 |
| 726 Millstream Dr #726 | 0.30mi | 2/2.0 (-1) | 1,383 (+4%) | 14mo | $265,000 | $192 | 63 |
| 393 Chateau La Salle Dr #393 | 0.73mi | 3/3.0 | 1,488 (+12%) | 2mo | $492,000 | $331 | 41 |
Match score weights: distance 35% · size 25% · config 20% · recency 20%. Top-matched comps best support the ARV.
Projected returns pro-forma
-3.0% appreciation · 3.97% rent growth · sell at horizon
- IRR
- -9.1%
- Equity multiple
- 0.66×
- Total profit
- $-36,757
- Equity at exit
- $57,984
- IRR
- 1.7%
- Equity multiple
- 1.13×
- Total profit
- $13,752
- Equity at exit
- $33,624
Cash invested: $108,889 (down + closing). Projections, not guarantees.
Landlord ↔ Tenant lean methodology
- Overall (CITY)
- 0 Strongly Tenant-Friendly
- State California
- 18 Strongly Tenant-Friendly · D+13
- County
- — inherits STATE
- City San Jose
- 0 Strongly Tenant-Friendly · D+24
ZIP-level market 95125
- Rents YoY
- 4.0%
- Active inventory
- 119
- Price-to-rent
- 8.0×
Monthly cashflow live
- Estimated rent
- $4,034 high interval (Pro) →
- Mortgage (P&I)
- −$2,039
- Tax est. 1.5%
- −$486 /mo · $5,833/yr
- Insurance
- −$162
- Flood insurance flood zone
- −$152 /mo · $1,824/yr
- HOA
- −$0
- Vacancy / Maint / Mgmt
- −$847
- Net cashflow
- $347
Break-even live
Sensitivity live
| Price | -10% $616 | -5% $482 | +0% $347 | +5% $213 | +10% $79 |
|---|---|---|---|---|---|
| Rent | -10% $29 | -5% $188 | +0% $347 | +5% $507 | +10% $666 |
| Rate | -1.0pp $543 | -0.5pp $446 | base $347 | +0.5pp $247 | +1.0pp $144 |
UW: 25.0% down · 7.5% · 30yr · 1.5% tax · 5.0% vac · 8.0% maint · 8.0% mgmt
Financing live
Cash to close
- Down payment
- $97,222
- Closing costs
- $11,667
- Reserves months
- —
- Total cash needed
- —
Loan-product check · same deal, 3 products live
Conventional
25% down · 7.5% · 30yr
- Down + closing
- —
- Monthly P&I
- —
- Monthly cashflow
- —
- DSCR
- —
- Eligible?
- —
Personal DTI + credit; lowest rate.
DSCR
20% down · 8.5% · 30yr
- Down + closing
- —
- Monthly P&I
- —
- Monthly cashflow
- —
- DSCR
- —
- Eligible?
- —
No personal income docs; deal must DSCR.
Hard money
10% down · 12.0% · 12mo
- Down + closing
- —
- Monthly P&I
- —
- Monthly cashflow
- —
- DSCR
- —
- Eligible?
- —
Short-term bridge; refi at stabilization.
Rent comps 28 comps
| Address | Beds | Baths | Sqft | Rent | $/sqft | DOM | Units | Dist |
|---|---|---|---|---|---|---|---|---|
| 334 Olive Hill Dr San Jose, CA | 2.0 | 3.0 | 1368 | $4,150 | $3.03 | 0d | 1 | 0.23mi |
| 262 Azevedo Cir #1603 San Jose, CA | 3.0 | 3.0 | 1620 | $3,720 | $2.30 | 0d | 1 | 0.31mi |
| 1277 Babb Ct San Jose, CA | 2.0 | 2.0 | 1123 | $3,550 | $3.16 | 0d | 2 | 0.38mi |
| 2212 Almaden Rd Unit B San Jose, CA | 2.0 | 2.0 | 1200 | $3,195 | $2.66 | 6d | 1 | 0.47mi |
| 590 Almaden Walk Loop San Jose, CA | 3.0 | 3.0 | 1425 | $3,995 | $2.80 | 46d | 1 | 0.57mi |
| 2070 Mary Helen Ln San Jose, CA | 3.0 | 4.0 | 1781 | $4,495 | $2.52 | 0d | 1 | 0.63mi |
| 2988 Grassina St #309 San Jose, CA | 2.0 | 2.0 | 1048 | $3,600 | $3.44 | 4d | 1 | 0.75mi |
| 1036 Cumberland Pl San Jose, CA | 2.0 | 2.0 | 1264 | $5,375 | $4.25 | 46d | 1 | 0.87mi |
| 559 Manor Dr Unit NA San Jose, CA | 2.0 | 1.5 | 1200 | $3,300 | $2.75 | 46d | 1 | 0.95mi |
| 45 Esfahan Dr San Jose, CA | 3.0 | 2.5 | 1794 | $4,395 | $2.45 | 0d | 1 | 1.01mi |
| 1866 Glen Una Ave San Jose, CA | 3.0 | 2.0 | 1359 | $4,500 | $3.31 | 5d | 1 | 1.02mi |
| 3024 Goodacre Pl San Jose, CA | 3.0 | 2.5 | 1431 | $2,200 | $1.54 | 46d | 1 | 1.03mi |
| 3200 Rubino Dr San Jose, CA | 1.0–2.0 | 1.0–2.0 | 928 | $3,720 | $4.01 | 0d | 1 | 1.04mi |
| 1109 Lincoln Ct San Jose, CA | 2.0 | 2.0 | 1118 | $3,600 | $3.22 | 4d | 1 | 1.04mi |
| 2986 Lina St #7 San Jose, CA | 3.0 | 3.0 | 1813 | $5,500 | $3.03 | 18d | 1 | 1.05mi |
| 3157 Regency Ave #612 San Jose, CA | 2.0 | 2.5 | 1282 | $4,195 | $3.27 | 4d | 1 | 1.12mi |
| 3158 Regency Ave San Jose, CA | 2.0 | 2.5 | 1257 | $3,695 | $2.94 | 0d | 1 | 1.13mi |
| 818 Foxworthy Ave San Jose, CA | 3.0 | 2.5 | 1589 | $4,700 | $2.96 | 19d | 1 | 1.15mi |
| 818 Foxworthy Ave San Jose, CA | 3.0 | 2.5 | 1589 | $4,700 | $2.96 | 22d | 1 | 1.15mi |
| 3115 Tuscolana Way #1595 San Jose, CA | 3.0 | 2.5 | 1580 | $4,430 | $2.80 | 18d | 1 | 1.15mi |
| 1528 Alma Ter San Jose, CA | 2.0 | 2.0 | 1054 | $3,695 | $3.51 | 0d | 1 | 1.24mi |
| 2276 Markham Ave San Jose, CA | 4.0 | 2.0 | 1577 | $4,995 | $3.17 | 26d | 1 | 1.25mi |
| 1232 Malone Rd San Jose, CA | 3.0 | 3.0 | 1711 | $6,995 | $4.09 | 18d | 1 | 1.29mi |
| 1619 Lincoln Ave San Jose, CA | 2.0 | 1.0 | 1236 | $3,900 | $3.16 | 6d | 1 | 1.34mi |
| 318 Araglin Ct San Jose, CA | 2.0 | 2.0 | 1168 | $3,300 | $2.83 | 5d | 1 | 1.35mi |
| 1395 Vine St San Jose, CA | 3.0 | 1.0 | 1500 | $3,525 | $2.35 | 26d | 1 | 1.39mi |
| 200 Lewis Rd San Jose, CA | 1.0–3.0 | 1.0–2.0 | 867 | $2,821 | $3.25 | 0d | 1 | 1.46mi |
| 1426 Ford Ave San Jose, CA | 2.0 | 1.0 | 900 | $2,800 | $3.11 | 17d | 1 | 1.48mi |
Listing history 8 events
-
2026-06-21days on market $388,888 Active 11 DOM
-
2026-06-18days on market $388,888 Active 8 DOM
-
2026-06-17days on market $388,888 Active 7 DOM
-
2026-06-16days on market $388,888 Active 6 DOM
-
2026-06-15days on market $388,888 Active 5 DOM
-
2026-06-13days on market $388,888 Active 3 DOM
-
2026-06-13remarks 687-char remark
-
2026-06-13$388,888 Active 2 DOM
ⓘ Source: listings_history table (triggers on properties + properties_extension) + one-shot
backfill from property_details.listing_events for pre-trigger history.
Climate risk First Street
- Flood 4/10 Moderate FEMA zone AH · 24% chance over 30 yrs
- Wildfire 1/10 Low
- Heat 5/10 Major 7 d/yr ≥94°F today · 14 d/yr by 30 yrs out
- Wind 1/10 Low
- Air quality 9/10 Extreme 17 unhealthy d/yr today · 17 by 30 yrs out
Nearby sold comps map
Loading sold comps map…
Walkable amenities ~0.75 mi
Loading nearby amenities…
Taxation est. · year 1
- Rental income
- $48,410
- − Mortgage interest
- −$21,784
- − Property taxes
- −$5,833
- − Insurance
- −$3,769
- − Repairs & maintenance
- −$3,873
- − Management
- −$3,873
- − Depreciation
- −$11,313
- Taxable loss
- −$2,034
- Est. tax savings @ 24.0%
- +$488
- After-tax cash flow
- $4,658/yr
For passive investors: Depreciation is non-cash, so a rental often shows a tax loss while cash-flowing — sheltering income. Rental losses are passive: they offset passive income freely, and up to $25,000/yr can offset ordinary (W-2) income if you actively participate and your MAGI is under $100k (phasing out to $0 by $150k); unused losses carry forward. On sale, claimed depreciation is recaptured at up to 25%, and gains may owe capital-gains tax (a 1031 exchange can defer both). Figures are a year-1 estimate at your 24.0% rate — not tax advice; consult a CPA.
Schools (NCES district)
- District
- East Side Union High
- NCES district ID
- 0611820
- Math proficiency
- 53% ▲ 12.00%
- Reading proficiency
- 70% ▲ 8.00%
- Median HH income
- $80,293
- Composite
- 55.15/100
- National rank
- #1278
- State rank
- #69 of 517 in CA
Livability — San Jose
- Score
- 78/100
- State rank
- #68
- US rank
- #2559
Category grades
Schools grade is shown separately in the Schools card above.
Census & demographics
- Census place
- San Jose, CA
- County
- Santa Clara County · 1,806,974 people
- City population
- 954,479
- Metro
- San Jose-Sunnyvale-Santa Clara, CA
- Population (ZIP)
- 54,419
- Household income
- $160,738
- Rent vs Own
- Severe rent burden
- 1772.0
Population outlook (Santa Clara County) Hauer SSP2
- Today (2025)
- 2,179,074 people
- By 2030
- 2,301,297 · +5.6%
- By 2040
- 2,528,195 · +16.0%
- By 2050
- 2,712,135 · +24.5%
- By 2075
- 2,998,701 · +37.6%
- By 2100
- 2,931,429 · +34.5%
Race, ethnicity, and origin ACS 2023
- Neighborhood character
- Diverse neighborhood (Simpson 0.67)
- Race & ethnicity
- White 47% Hispanic / Latino 29% Asian 17% Two or more races 17% Black 2%
- Hispanic origin (detail)
- Mexican 22%
- Common ancestry
- Italian 3% Lithuanian 2% Romanian 2%
- Foreign-born
- 24% · Canada, China, Vietnam
- Languages at home
- 65% English-only · Spanish 18% Other Indo-European 4% Chinese 3%
Political lean MEDSL · Santa Clara
- 2024 margin
- Solid D (+40.0) · D 68.1% · R 28.1% · Other 3.8%
- 2008→2024 swing
- -0.9pp no change · 2008: 40.9pp · 2024: 40.0pp
- All cycles
- 2024: D+40.0 2020: D+47.4 2016: D+52.5 2012: D+42.1 2008: D+40.9
Not yet ingested
- Civics
- —
Market trends
- HPI YoY
- ▼ -1489.34%
- Current HPI
- 364.2721
- Rent YoY
- ▲ 3.97%
- Metro
- San Jose-Sunnyvale-Santa Clara, CA
- State GDP YoY
- ▲ 3.21%
- F500 in state
- 116
Industry mix (Fortune 500 HQ in CA)
| Industry | F500 HQs | Revenue |
|---|---|---|
| Technology | 27 | $1,492B |
|
||
| Financial Services | 3 | $174B |
|
||
| Retail | 3 | $44B |
|
||
| Insurance | 3 | $26B |
|
||
| Media / Entertainment | 2 | $115B |
|
||
| Pharmaceuticals / Biotech | 2 | $62B |
|
||
Price history
+128.9% since first listed21 events — show timeline
- 2026-06-11 Listed $388,888 bridgeMLS, Bay East AOR, or Contra Costa AOR
- 2026-06-10 Coming Soon $388,888 bridgeMLS, Bay East AOR, or Contra Costa AOR
- 2017-12-29 Sold (MLS) $230,000 MLSListings
- 2017-11-01 Contingent — MLSListings
- 2017-10-12 Price Changed $239,000 MLSListings
- 2017-10-02 Price Changed $244,000 MLSListings
- 2017-07-25 Listed $249,000 MLSListings
- 2013-11-18 Sold (MLS) $224,500 MLSListings
- 2013-10-26 Pending — MLSListings
- 2013-10-09 Price Changed $159,000 MLSListings
- 2013-08-04 Listed $169,000 MLSListings
- 2011-08-08 Sold (MLS) $109,000 MLSListings
- 2011-07-30 Pending — MLSListings
- 2011-05-14 Price Changed $109,900 MLSListings
- 2011-03-11 Relisted — MLSListings
- 2011-03-07 Listing Removed — MLSListings
- 2010-10-08 Relisted — MLSListings
- 2010-10-08 Price Changed $144,900 MLSListings
- 2010-10-07 Listing Removed — MLSListings
- 2010-08-07 Price Changed $154,500 MLSListings
- 2010-06-25 Listed $169,900 MLSListings
Cash-flow waterfall
monthlySold comps — $/sqft
last 12 mo · ≤1 miLoading sold comps…