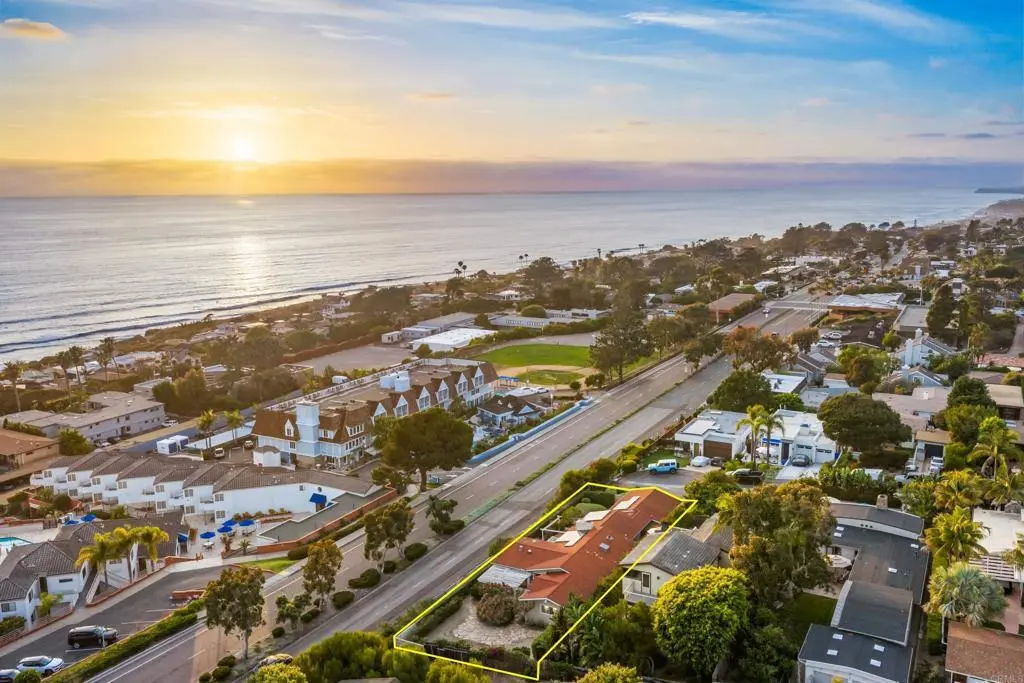
311 7Th St
Del Mar, CA 92014
$3,000,000D+
4 bd · 2.0 ba ·
1,979 sqft ·
Built 1977
· SingleFamily
· Pending Sale
· 8 DOM
Cashflow @ list (25.0% down · 7.5%)
Estimated rent
$14,516/mo
Mortgage (P&I)
−$15,732
Tax + insurance
−$1,879
HOA
−$0
Vac / Maint / Mgmt
−$3,048
Net cashflow
$-6,143/mo
Annual
$-73,722/yr
Cap rate
3.84%
Cash-on-cash
-8.78%
DSCR
0.61
1% rule
0.48%
Cash to close
$840,000
Investor read
- This is a 4-bed/2.0-bath single-family listed at $3.00M.
- At list price, monthly cash flow is $-6k ($-74k/yr) — negative.
- To cash-flow at today's rent, offer at most $1.91M (36.2% below list).
- To meet the 1% rule (rent ≥ 1% of price), the offer needs to be $1.45M (51.6% below list).
- Only 8 days on market — expect competitive offers; lowballing is unlikely to land.
- Recommended offer: $1.45M (51.6% below list) — sets the bar for 1% rule.
- In year one you build about $169k of equity ($21k loan paydown + $149k appreciation (5.0% local appreciation)).
- Location reads 74/100 on livability (#148 in CA, #4,969 nationally) — a middle-class / working-renter tenant base. Strengths: schools A+, commute A+, employment A+; Watch: housing D+, cost of living F, health & safety F.
- San Dieguito Union High (urban): math 72% / reading 79% proficiency, ranked #56 of 1,400 in CA (top 4%) — strong family-tenant draw, lease renewals of 3-5y typical; only 8% free/reduced lunch — higher-income household profile.
- Market conditions: Rents rising fast (+12.7%/yr); 81 active listings in the ZIP; 23 comparable units currently listed for rent nearby; rentals leasing fast (median 3d on market — plan ~1-2 weeks tenant-placement turnaround); high-income renter base; 11,759 units permitted in San Diego County in 2024 (7,244 in 5+ unit buildings).
- San Diego County population projected at +20% by 2050 — long-run rental-demand tailwind backs the buy-and-hold thesis.
- 3 sale attempts since 10y ago with the ask held roughly flat each time — persistent listings suggest the price (not the market) is what's stuck; bring a comps-based counter.
- Current owner paid $380k; list at $3.00M implies a 688% gain — meaningful room to come down on a strong offer.
- By year 2, paydown + projected appreciation supports a ~$272k cash-out refi (75% LTV) — recoverable capital for the next deal without selling this one.
- At $14,516/mo this rent would consume 88% of the median local household income ($199k/yr) (locally 343% of renters already pay >50% of income on rent) — very limited rent-growth headroom before tenants either downsize or default.
Questions for listing agent
- What do current leases actually rent for vs. the listed asking? Can we see a recent rent roll and the last 12 months of T-12 income?
- Built in 1977 — when were the roof, HVAC, electrical panel, plumbing, and water heater last replaced?
- Is there a deadline driving the sale (1031 exchange, divorce, estate, relocation)? That informs how much negotiation room exists.
- Schools are A-rated — typically a magnet for longer-tenancy family renters. What's the average tenant stay here, and is there a school-zone premium baked into asking?
- The area grade is low — what's the realistic commute time and amenity access for the typical tenant pool here? Any planned neighborhood developments (good or bad) we should know about?
- What's the average days-on-market for RENTAL listings here right now (not sales)? A rising rental-DOM trend means longer vacancies and softer asking-rent achievability than the comps imply.
- What's the recent tenant-quality profile in this submarket — average credit score on applications, eviction rate, late-payment / NSF rate, and stable-employment percentage? A property-management company in the area should have these aggregated.
- How much new for-sale + rental construction is in the pipeline within 1–3 miles? Heavy new supply typically softens prices + rents 12–24 months out; constrained supply supports both.
CashFlowRE · CFR-9X9M7XA488ZM38
· Data 3 h ago
cashflowre.app · 2026-05-29