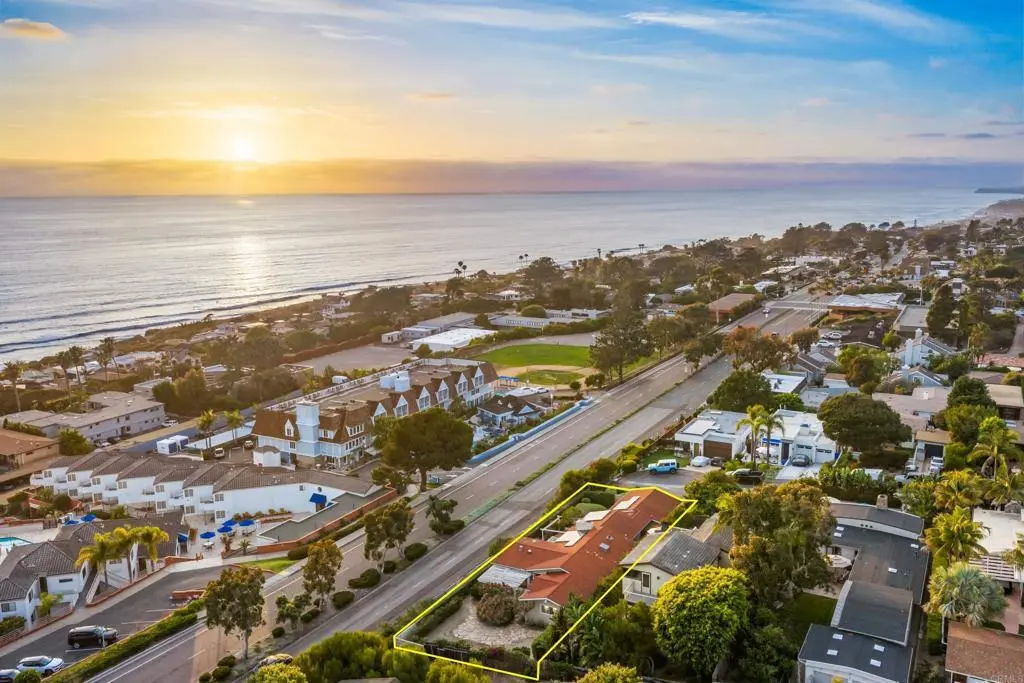
311 7Th St · Del Mar, CA
Flood risk 1/10 · Minimal
- FEMA flood zone
- X (unshaded)
- Chance of flooding over 30 yrs
- 0.0%
- Est. flood insurance / yr
- $507 – $1,088
Fire risk 1/10 · Minimal
- Est. fire insurance / yr
- $659 – $1,223
Heat risk 3/10 · Minor
- Hot days now (above 86°F)
- 6 days/yr
- Hot days in 30 yrs
- 17 days/yr
Wind risk 1/10 · Minimal
- Chance of severe wind over 30 yrs
- —
Air-quality risk 4/10 · Minor
- Unhealthy air days now
- 4 days/yr
- Unhealthy air days in 30 yrs
- 4 days/yr
Risk factors via First Street. Map © Google.
Why this score? — see what drove the D+ grade
The composite is a weighted blend of 9 inputs, each scored 0–100. Each bar is that input's sub-score; the figure is the points it added to the 100-point composite (weight × sub-score).
- ARV discount +15.0/15.0
- Appreciation +7.5/10.0
- Schools +7.1/10.0
- Cash flow +5.7/30.0
- Rent growth +5.0/5.0
- Livability +3.7/5.0
- Condition / age +2.5/5.0
- DSCR +0.1/10.0
- 1% rule +0.0/10.0
$3,000,000
🖨 Deal sheet (PDF) 📄 Offer letter ✓ Due diligence
Listing remarks
Olde Del Mar heritage home on a spacious lot with exceptional walkability and sweeping ocean views. Come tour this lofty single-level floor plan with high ceilings and oversized windows, where every room opens onto patios, gardens, and ocean views beyond. Your passport to an authentic Del Mar Village lifestyle and everything coastal North County has to offer. [SEE virtual tour for brochure and video]
Key facts
- Spacious lot
- Patios
- Gardens
Tags
Property features AI
Finance
- Other: Parcel number available
- HOA & community: Suburban neighborhood
Exterior
- Parking: Attached garage with two garage spaces; Driveway parking; Total of 4 parking spaces (includes uncovered spaces)
- Utilities: Public records listed for lot and living area
- Home design: Single-family residence; Single-story; Entry at ground level; Zoned R-1 (single family)
- Construction: No common walls with neighboring properties
- Exterior features: No pool; Backyard; Garden; Lot is level/flat; Located on a cul-de-sac; Has a view
Interior
- Kitchen: Kitchen (appliances not specified)
- Bedrooms: Primary bedroom (main level)
- Flooring: Carpet; Wood flooring
- Bathrooms: 2 full bathrooms
- Heating & cooling: Central furnace heating
- Interior features: One-level home; Primary bedroom; Office; Living room; Family room; Primary bathroom; Has a living room fireplace; Entry at street level
- Laundry & utility: Laundry area located in the garage
Neighborhood map
What this means for you Summary
Snapshot
- This is a 4-bed/2.0-bath single-family listed at $3.00M.
Deal economics
- At list price, monthly cash flow is $-6k ($-74k/yr) — negative.
- To cash-flow at today's rent, offer at most $1.91M (36.2% below list).
- To meet the 1% rule (rent ≥ 1% of price), the offer needs to be $1.45M (51.6% below list).
- Recommended offer: $1.45M (51.6% below list) — sets the bar for 1% rule.
Location & tenants
- Location reads 74/100 on livability (#148 in CA, #4,969 nationally) — a middle-class / working-renter tenant base. Strengths: schools A+, commute A+, employment A+; Watch: housing D+, cost of living F, health & safety F.
- San Dieguito Union High (urban): math 72% / reading 79% proficiency, ranked #56 of 1,400 in CA (top 4%) — strong family-tenant draw, lease renewals of 3-5y typical; only 8% free/reduced lunch — higher-income household profile.
- Market conditions: Rents rising fast (+12.7%/yr); 82 active listings in the ZIP; 23 comparable units currently listed for rent nearby; rentals leasing fast (median 3d on market — plan ~1-2 weeks tenant-placement turnaround); high-income renter base; 11,759 units permitted in San Diego County in 2024 (7,244 in 5+ unit buildings).
- At $14,516/mo this rent would consume 88% of the median local household income ($199k/yr) (locally 343% of renters already pay >50% of income on rent) — very limited rent-growth headroom before tenants either downsize or default.
Forward outlook
- In year one you build about $169k of equity ($21k loan paydown + $149k appreciation (5.0% local appreciation)).
- San Diego County population projected at +20% by 2050 — long-run rental-demand tailwind backs the buy-and-hold thesis.
- By year 2, paydown + projected appreciation supports a ~$272k cash-out refi (75% LTV) — recoverable capital for the next deal without selling this one.
Negotiation context
- Only 7 days on market — expect competitive offers; lowballing is unlikely to land.
- 3 sale attempts since 10y ago with the ask held roughly flat each time — persistent listings suggest the price (not the market) is what's stuck; bring a comps-based counter.
- Current owner paid $380k; list at $3.00M implies a 688% gain — meaningful room to come down on a strong offer.
Questions for the listing agent
- What do current leases actually rent for vs. the listed asking? Can we see a recent rent roll and the last 12 months of T-12 income?
- Built in 1977 — when were the roof, HVAC, electrical panel, plumbing, and water heater last replaced?
- Is there a deadline driving the sale (1031 exchange, divorce, estate, relocation)? That informs how much negotiation room exists.
- Schools are A-rated — typically a magnet for longer-tenancy family renters. What's the average tenant stay here, and is there a school-zone premium baked into asking?
- The area grade is low — what's the realistic commute time and amenity access for the typical tenant pool here? Any planned neighborhood developments (good or bad) we should know about?
- What's the average days-on-market for RENTAL listings here right now (not sales)? A rising rental-DOM trend means longer vacancies and softer asking-rent achievability than the comps imply.
- What's the recent tenant-quality profile in this submarket — average credit score on applications, eviction rate, late-payment / NSF rate, and stable-employment percentage? A property-management company in the area should have these aggregated.
- How much new for-sale + rental construction is in the pipeline within 1–3 miles? Heavy new supply typically softens prices + rents 12–24 months out; constrained supply supports both.
Investment metrics
- 1% rule
- 0.48% ✗
- Cap rate
- 3.84%
- Cash-on-cash
- -8.78%
- DSCR
- 0.61
- GRM
- 17.2
CMA / ARV
- ARV (on-the-fly)
- $4,058,929
- Comps found
- 12
Show comp detail 12 sales within ~0.75 mi
| Address | Dist | Beds/Ba | Sqft | Sold | Price | $/sf | Match |
|---|---|---|---|---|---|---|---|
| 1130 Cuchara Dr | 0.36mi | 4/2.0 | 1,921 (-3%) | 3mo | $4,300,000 | $2,238 | 76 |
| 14042 Rue Monaco | 0.24mi | 4/2.0 | 2,160 (+9%) | 1mo | $4,430,057 | $2,051 | 73 |
| 145 13th St | 0.47mi | 3/2.5 (-1) | 1,965 (-1%) | 10mo | $4,200,000 | $2,137 | 62 |
| 335 10th St | 0.23mi | 3/3.0 (-1) | 2,065 (+4%) | 14mo | $4,205,000 | $2,036 | 61 |
| 126 7th St | 0.17mi | 3/3.0 (-1) | 2,239 (+13%) | 1mo | $4,300,000 | $1,921 | 61 |
| 425 11th St | 0.30mi | 3/2.0 (-1) | 1,772 (-10%) | 5mo | $4,385,000 | $2,475 | 59 |
| 459 Carolina Rd | 0.59mi | 3/2.0 (-1) | 2,074 (+5%) | 2mo | $4,200,000 | $2,025 | 57 |
| 144 Ocean View Ave | 0.46mi | 4/3.0 | 2,114 (+7%) | 9mo | $5,200,000 | $2,460 | 56 |
| 13814 Recuerdo Dr | 0.57mi | 4/2.0 | 1,776 (-10%) | 3mo | $2,400,000 | $1,351 | 54 |
| 1407 Ocean Ave | 0.57mi | 3/3.5 (-1) | 2,117 (+7%) | 1mo | $4,300,000 | $2,031 | 50 |
| 1219 Stratford Ct | 0.43mi | 3/3.0 (-1) | 1,757 (-11%) | 14mo | $5,000,000 | $2,846 | 41 |
| 13711 Mercado Dr | 0.70mi | 3/2.0 (-1) | 1,750 (-12%) | 14mo | $2,600,000 | $1,486 | 32 |
Match score weights: distance 35% · size 25% · config 20% · recency 20%. Top-matched comps best support the ARV.
Projected returns pro-forma
4.95% appreciation · 8.0% rent growth · sell at horizon
- IRR
- 6.7%
- Equity multiple
- 1.44×
- Total profit
- $367,160
- Equity at exit
- $1,691,518
- IRR
- 10.1%
- Equity multiple
- 2.94×
- Total profit
- $1,633,435
- Equity at exit
- $2,912,291
Cash invested: $840,000 (down + closing). Projections, not guarantees.
Landlord ↔ Tenant lean methodology
- Overall (STATE)
- 18 Strongly Tenant-Friendly
- State California
- 18 Strongly Tenant-Friendly · D+13
- County
- — inherits STATE
- City
- — inherits STATE
ZIP-level market 92014
- Home prices YoY
- 1.1%
- Rents YoY
- 12.7%
- Active inventory
- 82
- Price-to-rent
- 17.2×
Monthly cashflow live
- Estimated rent
- $14,516 high interval (Pro) →
- Mortgage (P&I)
- −$15,732
- Tax from tax record
- −$629 /mo · $7,544/yr
- Insurance
- −$1,250
- HOA
- −$0
- Vacancy / Maint / Mgmt
- −$3,048
- Net cashflow
- $-6,143
Break-even live
Sensitivity live
| Price | -10% $-4,445 | -5% $-5,294 | +0% $-6,143 | +5% $-6,993 | +10% $-7,842 |
|---|---|---|---|---|---|
| Rent | -10% $-7,290 | -5% $-6,717 | +0% $-6,143 | +5% $-5,570 | +10% $-4,997 |
| Rate | -1.0pp $-4,633 | -0.5pp $-5,380 | base $-6,143 | +0.5pp $-6,921 | +1.0pp $-7,712 |
UW: 25.0% down · 7.5% · 30yr · 1.5% tax · 5.0% vac · 8.0% maint · 8.0% mgmt
Financing live
Cash to close
- Down payment
- $750,000
- Closing costs
- $90,000
- Reserves months
- —
- Total cash needed
- —
Loan-product check · same deal, 3 products live
Conventional
25% down · 7.5% · 30yr
- Down + closing
- —
- Monthly P&I
- —
- Monthly cashflow
- —
- DSCR
- —
- Eligible?
- —
Personal DTI + credit; lowest rate.
DSCR
20% down · 8.5% · 30yr
- Down + closing
- —
- Monthly P&I
- —
- Monthly cashflow
- —
- DSCR
- —
- Eligible?
- —
No personal income docs; deal must DSCR.
Hard money
10% down · 12.0% · 12mo
- Down + closing
- —
- Monthly P&I
- —
- Monthly cashflow
- —
- DSCR
- —
- Eligible?
- —
Short-term bridge; refi at stabilization.
Rent comps 23 comps
| Address | Beds | Baths | Sqft | Rent | $/sqft | DOM | Units | Dist |
|---|---|---|---|---|---|---|---|---|
| 152 7th St Del Mar, CA | 3.0 | 3.5 | 2561 | $18,000 | $7.03 | 0d | 1 | 0.13mi |
| 111 Little Orphan Aly Del Mar, CA | 3.0 | 2.5 | 1595 | $20,000 | $12.54 | 0d | 1 | 0.18mi |
| 110 8th St Del Mar, CA | 5.0 | 4.0 | 2281 | $42,000 | $18.41 | 22d | 1 | 0.20mi |
| 335 10th St Del Mar, CA | 3.0 | 3.0 | 2065 | $25,000 | $12.11 | 0d | 1 | 0.23mi |
| 950 Stratford Ct Del Mar, CA | 3.0 | 2.0 | 1800 | $6,500 | $3.61 | 11d | 1 | 0.25mi |
| 678 Orchid Ln Del Mar, CA | 4.0 | 3.0 | 2600 | $8,500 | $3.27 | 0d | 1 | 0.31mi |
| 573 Amphitheatre Dr Del Mar, CA | 4.0 | 3.0 | 2000 | $12,000 | $6.00 | 17d | 1 | 0.36mi |
| 531 Rimini Rd Del Mar, CA | 4.0 | 3.0 | 2540 | $20,600 | $8.11 | 0d | 1 | 0.51mi |
| 14186 Half Moon Bay Dr Del Mar, CA | 3.0 | 2.0 | 1284 | $8,500 | $6.62 | 0d | 1 | 0.69mi |
| 1654 Camino Del Mar Del Mar, CA | 3.0 | 3.0 | 2000 | $8,500 | $4.25 | 15d | 1 | 0.81mi |
| 459 Culebra St Del Mar, CA | 3.0 | 3.5 | 2150 | $17,000 | $7.91 | 17d | 1 | 0.95mi |
| 1812 Ocean Del Mar, CA | 3.0 | 2.0 | 1650 | $14,750 | $8.94 | 20d | 1 | 0.96mi |
| 13053 Caminito del Rocio Del Mar, CA | 3.0 | 3.5 | 2234 | $7,300 | $3.27 | 0d | 1 | 1.05mi |
| 2028 Ocean Front Del Mar, CA | 3.0 | 3.0 | 1772 | $30,000 | $16.93 | 0d | 1 | 1.13mi |
| 12931 Caminito de las Olas Del Mar, CA | 3.0 | 2.0 | 1561 | $12,500 | $8.01 | 0d | 1 | 1.14mi |
| 2050 Ocean Front Del Mar, CA | 5.0 | 5.0 | 2100 | $40,000 | $19.05 | 22d | 1 | 1.15mi |
| 12933 Caminito del Canto Del Mar, CA | 3.0 | 2.5 | 1689 | $11,000 | $6.51 | 0d | 1 | 1.19mi |
| 13232 Ocean Vista Rd San Diego, CA | 3.0 | 2.0 | 1620 | $6,299 | $3.89 | 2d | 1 | 1.20mi |
| 136 23rd St Del Mar, CA | 3.0 | 4.0 | 2367 | $60,000 | $25.35 | 22d | 1 | 1.26mi |
| 13286 Ocean Vista Rd San Diego, CA | 3.0 | 3.5 | 2479 | $9,999 | $4.03 | 13d | 1 | 1.29mi |
| 2435 Camino del Mar Del Mar, CA | 4.0 | 3.0 | 1464 | $10,900 | $7.45 | 0d | 1 | 1.33mi |
| 13049 Shalimar Pl Del Mar, CA | 4.0 | 3.0 | 2568 | $9,000 | $3.50 | 14d | 1 | 1.40mi |
| 12969 Candela Pl San Diego, CA | 3.0 | 2.5 | 1668 | $5,850 | $3.51 | 2d | 1 | 1.41mi |
Listing history 7 events
-
2026-06-18days on market $3,000,000 Active 7 DOM
-
2026-06-17days on market $3,000,000 Active 6 DOM
-
2026-06-16days on market $3,000,000 Active 5 DOM
-
2026-06-15days on market $3,000,000 Active 4 DOM
-
2026-06-13days on market $3,000,000 Active 2 DOM
-
2026-06-13remarks 403-char remark
-
2026-06-13$3,000,000 Active 1 DOM
ⓘ Source: listings_history table (triggers on properties + properties_extension) + one-shot
backfill from property_details.listing_events for pre-trigger history.
Tax reassessment forecast CA · Resets to sale price
- Current annual tax
- $7,544 · $629/mo
- Projected year-2 tax
- $22,800 · $1,900/mo
- Expected delta
- +$15,256/yr (+$1,271/mo · 202.2%)
ⓘ Screening estimate from a state-policy table — verify with the county assessor before closing.
Climate risk First Street
- Flood 1/10 Low FEMA zone X (unshaded) · 0% chance over 30 yrs
- Wildfire 1/10 Low
- Heat 3/10 Moderate 6 d/yr ≥86°F today · 17 d/yr by 30 yrs out
- Wind 1/10 Low
- Air quality 4/10 Moderate 4 unhealthy d/yr today · 4 by 30 yrs out
Nearby sold comps map
Loading sold comps map…
Walkable amenities ~0.75 mi
Loading nearby amenities…
Taxation est. · year 1
- Rental income
- $174,191
- − Mortgage interest
- −$168,047
- − Property taxes
- −$7,544
- − Insurance
- −$15,000
- − Repairs & maintenance
- −$13,935
- − Management
- −$13,935
- − Depreciation
- −$87,273
- Taxable loss
- −$131,543
- Est. tax savings @ 24.0%
- +$31,570
- After-tax cash flow
- $-42,151/yr
For passive investors: Depreciation is non-cash, so a rental often shows a tax loss while cash-flowing — sheltering income. Rental losses are passive: they offset passive income freely, and up to $25,000/yr can offset ordinary (W-2) income if you actively participate and your MAGI is under $100k (phasing out to $0 by $150k); unused losses carry forward. On sale, claimed depreciation is recaptured at up to 25%, and gains may owe capital-gains tax (a 1031 exchange can defer both). Figures are a year-1 estimate at your 24.0% rate — not tax advice; consult a CPA.
Schools (NCES district)
- District
- San Dieguito Union High
- NCES district ID
- 0634380
- Math proficiency
- 72% ▬ 0.00%
- Reading proficiency
- 79% ▼ -1.00%
- Median HH income
- $110,199
- Composite
- 70.63/100
- National rank
- #519
- State rank
- #56 of 1400 in CA
Livability — Del Mar
- Score
- 74/100
- State rank
- #148
- US rank
- #4969
Category grades
Schools grade is shown separately in the Schools card above.
Census & demographics
- Census place
- Del Mar, CA
- County
- San Diego County · 3,178,799 people
- Metro
- San Diego-Chula Vista-Carlsbad, CA
- Population (ZIP)
- 13,105
- Household income
- $198,823
- Rent vs Own
- Severe rent burden
- 343.0
Population outlook (San Diego County) Hauer SSP2
- Today (2025)
- 3,678,185 people
- By 2030
- 3,856,546 · +4.8%
- By 2040
- 4,171,407 · +13.4%
- By 2050
- 4,421,607 · +20.2%
- By 2075
- 4,831,599 · +31.4%
- By 2100
- 4,832,502 · +31.4%
Race, ethnicity, and origin ACS 2023
- Neighborhood character
- Predominantly White (76%)
- Race & ethnicity
- White 76% Hispanic / Latino 10% Two or more races 9% Asian 6% Black 1%
- Hispanic origin (detail)
- Mexican 6%
- Common ancestry
- Italian 5% Scotch-Irish 4% Romanian 4%
- Foreign-born
- 16% · Canada, China, South Korea
- Languages at home
- 88% English-only · Spanish 4% Other Indo-European 2% Other Asian/Pacific 1%
Political lean MEDSL · San Diego
- 2024 margin
- D (+16.8) · D 56.9% · R 40.1% · Other 2.9%
- 2008→2024 swing
- +6.6pp toward D · 2008: 10.2pp · 2024: 16.8pp
- All cycles
- 2024: D+16.8 2020: D+22.8 2016: D+17.8 2012: D+5.1 2008: D+10.2
Not yet ingested
- Civics
- —
Market trends
- HPI YoY
- ▲ 4.95%
- Current HPI
- 445.7503
- Rent YoY
- ▲ 12.74%
- Metro
- San Diego-Chula Vista-Carlsbad, CA
- State GDP YoY
- ▲ 3.21%
- F500 in state
- 116
Industry mix (Fortune 500 HQ in CA)
| Industry | F500 HQs | Revenue |
|---|---|---|
| Technology | 27 | $1,492B |
|
||
| Financial Services | 3 | $174B |
|
||
| Retail | 3 | $44B |
|
||
| Insurance | 3 | $26B |
|
||
| Media / Entertainment | 2 | $115B |
|
||
| Pharmaceuticals / Biotech | 2 | $62B |
|
||
Price history
+1224.5% since first listed13 events — show timeline
- 2026-06-11 Listed $3,000,000 CRMLS
- 2016-11-03 Listing Removed — SDMLS
- 2016-08-15 Listing Removed — SDMLS
- 2016-08-15 Listed $1,799,000 SDMLS
- 2016-06-15 Price Changed $1,799,000 SDMLS
- 2016-06-08 Price Changed $1,825,000 SDMLS
- 2016-06-07 Price Changed $1,819,000 SDMLS
- 2016-05-25 Price Changed $1,825,000 SDMLS
- 2016-04-14 Price Changed $1,899,000 SDMLS
- 2016-03-11 Listed $1,950,000 SDMLS
- 1993-06-30 Sold (Public Records) $380,500 Public Records
- 1988-12-28 Sold (Public Records) $370,000 Public Records
- 1985-08-30 Sold (Public Records) $226,500 Public Records
Property tax history
+1.9%/yrLatest (2025): $7,544 · +2.0% YoY. Source: county tax records.
Cash-flow waterfall
monthlySold comps — $/sqft
last 12 mo · ≤1 miLoading sold comps…