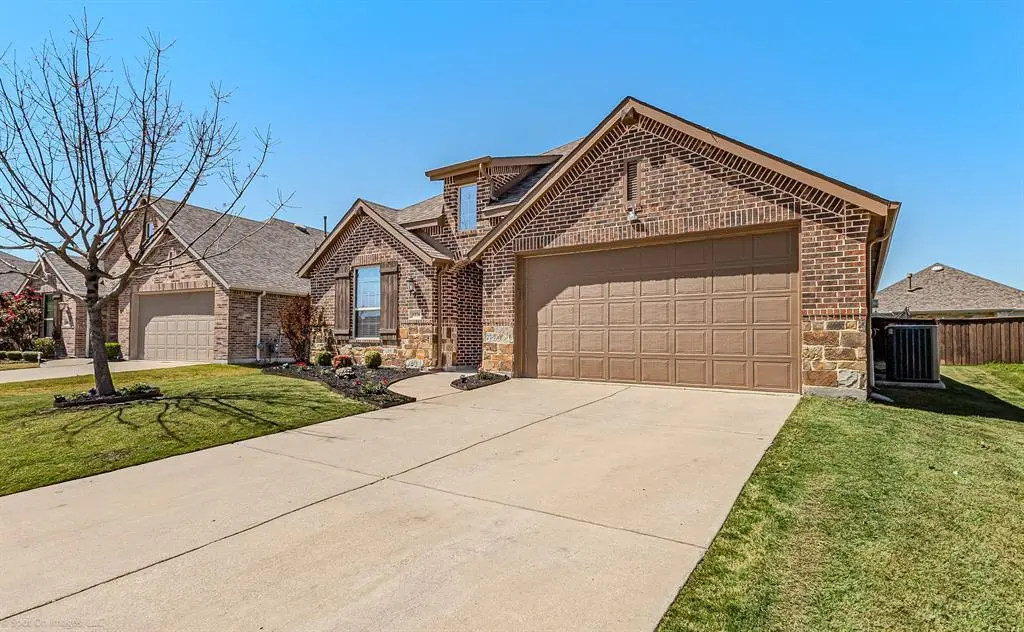
1276 Meridian Dr
Forney, TX 75126
$315,000D-
4 bd · 2.0 ba ·
2,162 sqft ·
Built 2017
· SingleFamily
· Pending
· 70 DOM
Cashflow @ list (25.0% down · 7.5%)
Estimated rent
$2,645/mo
Mortgage (P&I)
−$1,652
Tax + insurance
−$759
HOA
−$75
Vac / Maint / Mgmt
−$556
Net cashflow
$-396/mo
Annual
$-4,756/yr
Cap rate
4.78%
Cash-on-cash
-5.39%
DSCR
0.76
1% rule
0.84%
Cash to close
$88,200
Investor read
- This is a 4-bed/2.0-bath single-family listed at $315k.
- At list price, monthly cash flow is $-396 ($-5k/yr) — negative.
- To cash-flow at today's rent, offer at most $245k (22.2% below list).
- To meet the 1% rule (rent ≥ 1% of price), the offer needs to be $265k (16.0% below list).
- It's been on market 70 days — a 6% lower offer ($296k) is reasonable based on typical stale-listing flexibility.
- Recommended offer: $245k (22.2% below list) — sets the bar for cash-flow.
- Local home prices are declining (-3.0%/yr); year-one equity from $2k of loan paydown is wiped out by about $9k of value loss. Plan a longer hold.
- Location reads 76/100 on livability (#98 in TX, #3,339 nationally) — a middle-class / working-renter tenant base. Strengths: crime A+, employment A+, cost of living A+; Watch: amenities C-, commute F.
- Forney ISD (rural): math 41% / reading 44% proficiency, ranked #234 of 826 in TX (top 28%) — families likely to look elsewhere, expect single-tenant / working-renter base with shorter leases.
- Zoned schools: Henderson El (math 52% / reading 54%, grade C, #705 of 4,322 statewide, top 17%, 737 students, 50% FRL); Warren Middle (math 43% / reading 50%, grade D+, #443 of 1,662 statewide, top 28%, 903 students, 26% FRL); Forney H S (math 64% / reading 58%, grade C+, #258 of 1,632 statewide, top 16%, 2,272 students, 28% FRL).
- Market conditions: Rents rising (+1.4%/yr); 2200 active listings in the ZIP; 40 comparable units currently listed for rent nearby; rentals at typical pace (median 19d on market — plan ~3-4 weeks tenant-placement turnaround); solid renter incomes; 1,747 units permitted in Kaufman County in 2024 (180 in 5+ unit buildings).
- Kaufman County population projected at +43% by 2050 — long-run rental-demand tailwind backs the buy-and-hold thesis.
- 2 sale attempts; this cycle's ask has dropped $24k (7%) from the opening price — seller is motivated, your offer sets the floor, not the list.
- Climate carrying-cost: major wind risk, 27% chance of damaging wind over 30y; major wildfire risk; extreme-heat days projected 7→24/yr by 2055 (HVAC capex compounding) — expect insurance premiums to compound above CPI over the hold.
- This rent runs 31% of the median local income ($104k/yr) — at the standard rent-burdened threshold; future hikes will face affordability resistance.
Questions for listing agent
- What do current leases actually rent for vs. the listed asking? Can we see a recent rent roll and the last 12 months of T-12 income?
- It's been on market 70 days. Have you received any prior offers? Is the seller open to a 22% concession, seller financing, or rate buy-down credit?
- What does the HOA fee cover, when was the last increase, and are there any pending special assessments or reserve-fund shortfalls?
- Why hasn't it sold? Are there any deal-killer items the seller is aware of (foundation, flood, title, zoning, code violations)?
- Is there a deadline driving the sale (1031 exchange, divorce, estate, relocation)? That informs how much negotiation room exists.
- Schools are B-rated — typically a magnet for longer-tenancy family renters. What's the average tenant stay here, and is there a school-zone premium baked into asking?
- The area grade is low — what's the realistic commute time and amenity access for the typical tenant pool here? Any planned neighborhood developments (good or bad) we should know about?
- What's the average days-on-market for RENTAL listings here right now (not sales)? A rising rental-DOM trend means longer vacancies and softer asking-rent achievability than the comps imply.
CashFlowRE · CFR-9XSYZT20E6PK5X
· Data 3 weeks ago
cashflowre.app · 2026-05-29