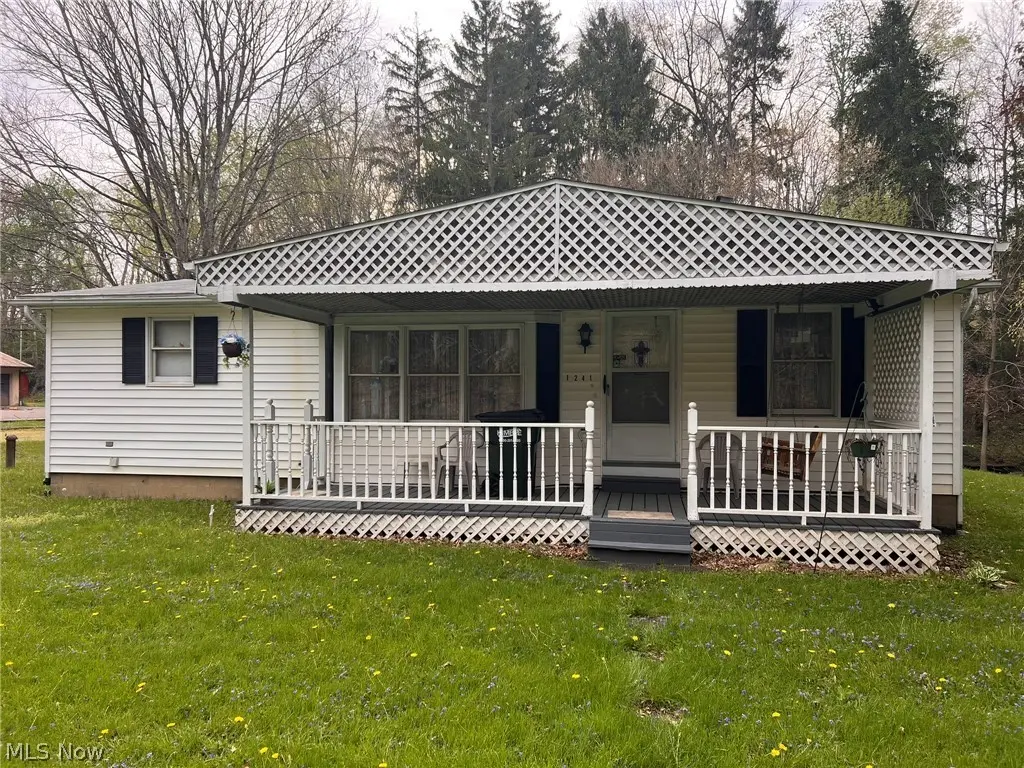
1241 Bison St NW
Massillon, OH 44647
$170,000D+
2 bd · 2.0 ba ·
1,452 sqft ·
Built 1987
· SingleFamily
· Pending
· 4 DOM
Cashflow @ list (25.0% down · 7.5%)
Estimated rent
$1,310/mo
Mortgage (P&I)
−$891
Tax + insurance
−$204
HOA
−$0
Vac / Maint / Mgmt
−$275
Net cashflow
$-61/mo
Annual
$-734/yr
Cap rate
6.25%
Cash-on-cash
-0.14%
DSCR
0.99
1% rule
0.77%
Cash to close
$47,600
Investor read
- This is a 2-bed/2.0-bath single-family listed at $170k.
- At list price, monthly cash flow is $-61 ($-734/yr) — negative.
- To cash-flow at today's rent, offer at most $159k (6.4% below list).
- To meet the 1% rule (rent ≥ 1% of price), the offer needs to be $131k (23.0% below list).
- Only 4 days on market — expect competitive offers; lowballing is unlikely to land.
- Recommended offer: $131k (23.0% below list) — sets the bar for 1% rule.
- Local home prices are declining (-3.0%/yr); year-one equity from $1k of loan paydown is wiped out by about $5k of value loss. Plan a longer hold.
- Location reads 74/100 on livability (#306 in OH, #4,928 nationally) — a middle-class / working-renter tenant base. Strengths: cost of living A+, housing A+, health & safety A-; Watch: employment C-, amenities F, commute F.
- Massillon City (urban): math 43% / reading 52% proficiency, ranked #487 of 656 in OH (top 74%) — families likely to look elsewhere, expect single-tenant / working-renter base with shorter leases; 60% free/reduced lunch — lower-income household profile, screen leases tightly.
- Zoned schools: Gorrell Elementary School (math 52% / reading 42%, grade D-, #942 of 1,584 statewide, top 61%, 408 students, 0% FRL); Massillon Intermediate School (math 38% / reading 51%, grade D, #477 of 654 statewide, top 74%, 880 students, 0% FRL); Washington High School (math 30% / reading 59%, grade F, #470 of 781 statewide, top 62%, 1,179 students, 0% FRL) — zoned schools average 0% FRL vs 60% district-wide (60 pts lower); this property's tenant base skews higher-income than the district average.
- Watch-outs: flood insurance adds $56/mo.
- Market conditions: 103 active listings in the ZIP; 1 comparable units currently listed for rent nearby; 528 units permitted in Stark County in 2024 (84 in 5+ unit buildings).
- Stark County population projected to shrink 8% by 2050 — rents likely to lag national; underwrite the cash flow, not the appreciation.
- Climate carrying-cost: severe flood risk — expect insurance premiums to compound above CPI over the hold.
- Cap rate 6.3% vs local median 3.8% in Massillon — top-decile yield for the area; either an underpriced asset or a hidden risk that comps aren't pricing in. Stress-test before assuming the spread holds.
Questions for listing agent
- What do current leases actually rent for vs. the listed asking? Can we see a recent rent roll and the last 12 months of T-12 income?
- What's the actual annual flood-insurance premium (NFIP or private), and is the property in a SFHA with mandatory coverage?
- Is there a deadline driving the sale (1031 exchange, divorce, estate, relocation)? That informs how much negotiation room exists.
- Schools are B-rated — typically a magnet for longer-tenancy family renters. What's the average tenant stay here, and is there a school-zone premium baked into asking?
- The area grade is low — what's the realistic commute time and amenity access for the typical tenant pool here? Any planned neighborhood developments (good or bad) we should know about?
- What's the average days-on-market for RENTAL listings here right now (not sales)? A rising rental-DOM trend means longer vacancies and softer asking-rent achievability than the comps imply.
- What's the recent tenant-quality profile in this submarket — average credit score on applications, eviction rate, late-payment / NSF rate, and stable-employment percentage? A property-management company in the area should have these aggregated.
- How much new for-sale + rental construction is in the pipeline within 1–3 miles? Heavy new supply typically softens prices + rents 12–24 months out; constrained supply supports both.
CashFlowRE · CFR-9Y4HCV1MGX0AK9
· Data 4 weeks ago
cashflowre.app · 2026-05-29